Read time :
B2B SaaS Revenue Metrics: The Numbers That Ensure Marketing and Sales Alignment
This guide covers the B2B SaaS metrics that connect marketing to sales results, including revenue, acquisition, pipeline velocity, and attribution models that show which activities drive closed deals.


This article was written to help you put an end to teams debating credit based on siloed revenue metrics. If you often hear marketers and sales argue over which closed deals were marketing or sales-driven, while finance is more interested in the reason why CAC keeps climbing while revenue stays flat, this one’s for you.
These conversations happen when teams track or define metrics differently. Alignment means measuring the same things the same way so everyone sees the same truth and works together to optimize processes and costs.
We see this firsthand in almost every demo. A Head of Marketing at an event technology company told us: "We have monthly debates with sales about whether a lead was marketing-generated or outbound. It happens all the time." That argument isn’t about ego; it’s due to a lack of shared data to settle it.
Revenue Metrics That Link Marketing and Sales
Revenue metrics are the “north star” that both teams own together. Neither marketing nor sales can drive revenue alone, which makes them well-suited to shared accountability.
While "north star" implies having one key metric for your team or business to focus on, which it shoud, here are the the three revenue metrics that marketing and sales should always be keeping a shared eye on.
Annual Recurring Revenue
ARR represents the predictable yearly revenue from subscriptions. Boards and investors care about ARR more than any other metric because it signals business health and growth trajectory.
Both teams impact ARR. Marketing influences acquisition quality and deal size, while sales affect negotiation and contract structure.
Monthly Recurring Revenue
MRR is the monthly equivalent of ARR and is useful for tracking short-term trends. Most teams calculate ARR by multiplying MRR by twelve.
Use MRR for operational decisions and ARR for strategic planning. Weekly MRR changes reveal campaign impact faster than waiting for quarterly ARR reports.
Net Revenue Retention
Net Revenue Retention (NRR) measures the percentage of recurring revenue retained from existing customers over a period, after factoring in upgrades, downgrades, and churn.
NRR reveals whether marketing attracts the right customers and whether sales close sustainable deals. High churn frequently stems from misaligned acquisition, not poor customer success. We’ve seen this pattern repeatedly with our clients: when attribution data shows which campaigns attract customers who expand rather than churn within six months, the conversation shifts from blame to budget reallocation.
B2B SaaS Marketing Metrics for Customer Acquisition
Acquisition metrics quantify how efficiently you gain customers. Marketing owns them, but sales validates them through deal outcomes.
Customer Acquisition Cost
CAC (Customer Acquisition Cost) is calculated by dividing total sales and marketing spend by the number of new customers. Deciding which costs to include (salaries, tools, overhead, or direct expenses) is a challenge. Clarify your definition for consistent measurement.
Inconsistent CAC definitions cause team friction. Document your calculation method and stick with it across both teams.
Here’s what makes this harder in practice: most teams calculate CAC from ad platform data, which only shows you the cost side. To understand the true cost of acquisition, you need to connect offline marketing activities such as webinars, events, and sales activity costs, alongside your digital spend. When all of that data lives natively in your CRM, you can calculate CAC at the channel and campaign level, not simply as a blended company average.
Customer Lifetime Value
Customer Lifetime Value (LTV) is the total revenue a business expects to earn from a customer over the entire relationship. It is calculated as average revenue per account (ARPA) multiplied by the average customer lifespan.
LTV depends on both acquisition quality and deal structure. Did marketing attract buyers who stick around? Did sales set realistic expectations?
LTV to CAC Ratio
The LTV-to-CAC ratio measures the value of a customer over their lifetime relative to the cost of acquiring them. A healthy ratio means LTV significantly exceeds CAC, resulting in a strong return on investment.
A ratio below 1:1 means you’re losing money on every customer. That’s not sustainable.
CAC Payback Period
The CAC payback period measures the number of months it takes for the profit generated by a new customer to fully cover the initial CAC. Shorter payback periods are associated with stronger business efficiency.
If payback takes 18 months but the average customer lifespan is 12 months, you have a problem. This metric forces honest conversations about acquisition efficiency.
Lead Qualification Metrics for Better Handoffs
Handoff friction between marketing and sales kills deals. Clear qualification definitions prevent blame games and improve conversion rates.
Marketing Qualified Leads
Marketing Qualified Leads (MQLs) are leads that meet marketing-driven criteria (such as downloading content, joining webinars, or visiting pricing pages repeatedly) that indicate a higher likelihood of becoming customers, based on historical data or scoring models.
The danger with MQLs is setting targets that don’t connect to revenue outcomes. Hitting MQL goals while the pipeline shrinks signals a definition problem.
Many companies evaluating attribution solutions face this: One SaaS client running campaigns on multiple platforms saw that their HubSpot/Salesforce separation hindered attribution and ROI tracking after the MQL stage. Marketing could count MQLs, but influence was lost after handoff, making it impossible to prove which campaigns accelerated deals.
Sales Qualified Leads
Sales Qualified Leads (SQLs) are those that sales teams have personally vetted through direct interaction, confirming attributes such as budget, authority, need, and timeline (often summarized as BANT).
Agreed-upon SQL criteria between teams prevents the “these leads are garbage” complaint. Document what makes a lead sales-ready and revisit quarterly.
Product Qualified Leads
Product Qualified Leads (PQLs) are users who show clear buying intent through product use, reaching defined activation points or using conversion-linked features. This is an essential lead type for SaaS providers that have multiple pricing tiers and complementary product offerings.
For product-led companies, PQLs often convert better than MQLs. Usage signals intent more reliably than content downloads.
Lead Scoring Connected to Revenue
Lead scoring is a method of assigning points to leads based on specific behaviours or characteristics (such as downloads, event attendance, or company size) that are historically shown to increase conversion likelihood. The scoring logic should be derived from patterns noted in successfully closed deals.
The best scoring models learn from revenue data. Which behaviours predict closed deals? Clients regularly struggle to interpret their scoring models. When content engagement data feeds are scored directly, the model becomes transparent, auditable, and more accurate.
CRM-native scoring keeps both teams working from the same data without exporting to external tools.
Pipeline Metrics Both Teams Own
Pipeline metrics sit in the middle of the funnel where marketing influence meets sales execution. They reveal bottlenecks and acceleration opportunities that neither team can see on its own.
Total Pipeline Value
Total pipeline value sums up the monetary value of all open sales opportunities (those still in process), showing the potential revenue available in the pipeline at a given time. It excludes leads that are not yet opportunities and closed deals.
A healthy pipeline typically covers 3-4x your revenue target. Less coverage means you’re gambling on high win rates.
Pipeline Velocity
Pipeline velocity measures the rate at which potential revenue moves through the sales pipeline. The formula is: (Number of opportunities × Average deal value × Win rate) divided by sales cycle length (days or months).
Faster velocity means more revenue in less time. Marketing can accelerate velocity by better targeting and delivering content that tackles buyer concerns earlier.
From analyzing hundreds of B2B buyer journeys, we’ve learned that the number of required marketing and sales touchpoints to close revenue is often higher than expected. Visualizing the journey helps reduce unnecessary touchpoints and focus on those that accelerate deals. That’s true pipeline velocity optimization.
Stage Conversion Rates
Stage conversion rates measure the percentage of deals progressing from one sales stage to the next, highlighting where deals stall or drop out.
Stage-by-stage analysis shows whether marketing delivers quality leads and whether sales advances them effectively.
Win Rate and Deal Size
Win rate is the proportion of sales opportunities that become closed/won deals. Deal size is the average value of those successful contracts.
Marketing’s targeting affects both metrics. Sales’s negotiation skills do too. Together, win rate and deal size indicate the health of alignment.
B2B SaaS Product Metrics for Retention and Expansion
Retention metrics reveal post-sale health. High churn frequently stems from misaligned acquisition, not poor customer success.
Gross Revenue Churn
Gross revenue churn is the percentage of recurring revenue lost to customer cancellations and downgrades over a period, before counting any offset from expansions.
High gross churn signals problems even if net retention looks healthy. You’re working harder just to stay in place.
Logo Churn Rate
Logo churn is the percentage of customer accounts lost, regardless of the revenue those customers generate. Losing ten small customers may hurt less than losing one enterprise account, but observing patterns is important.
Track both logo and revenue churn. They tell different stories about customer health.
Expansion Revenue
Expansion revenue is the additional revenue generated from existing customers through upsell and cross-sell activities. It is often the cheapest form of revenue to acquire.
Marketing can support expansion using targeted campaigns to existing customers. Strong expansion offsets acquisition costs and improves unit economics. With the right attribution setup, you can track expansion influence through content engagement, campaign touchpoints, and upsell support programs. This allows you to automatically connect expansion marketing activities to expansion deals in your CRM.
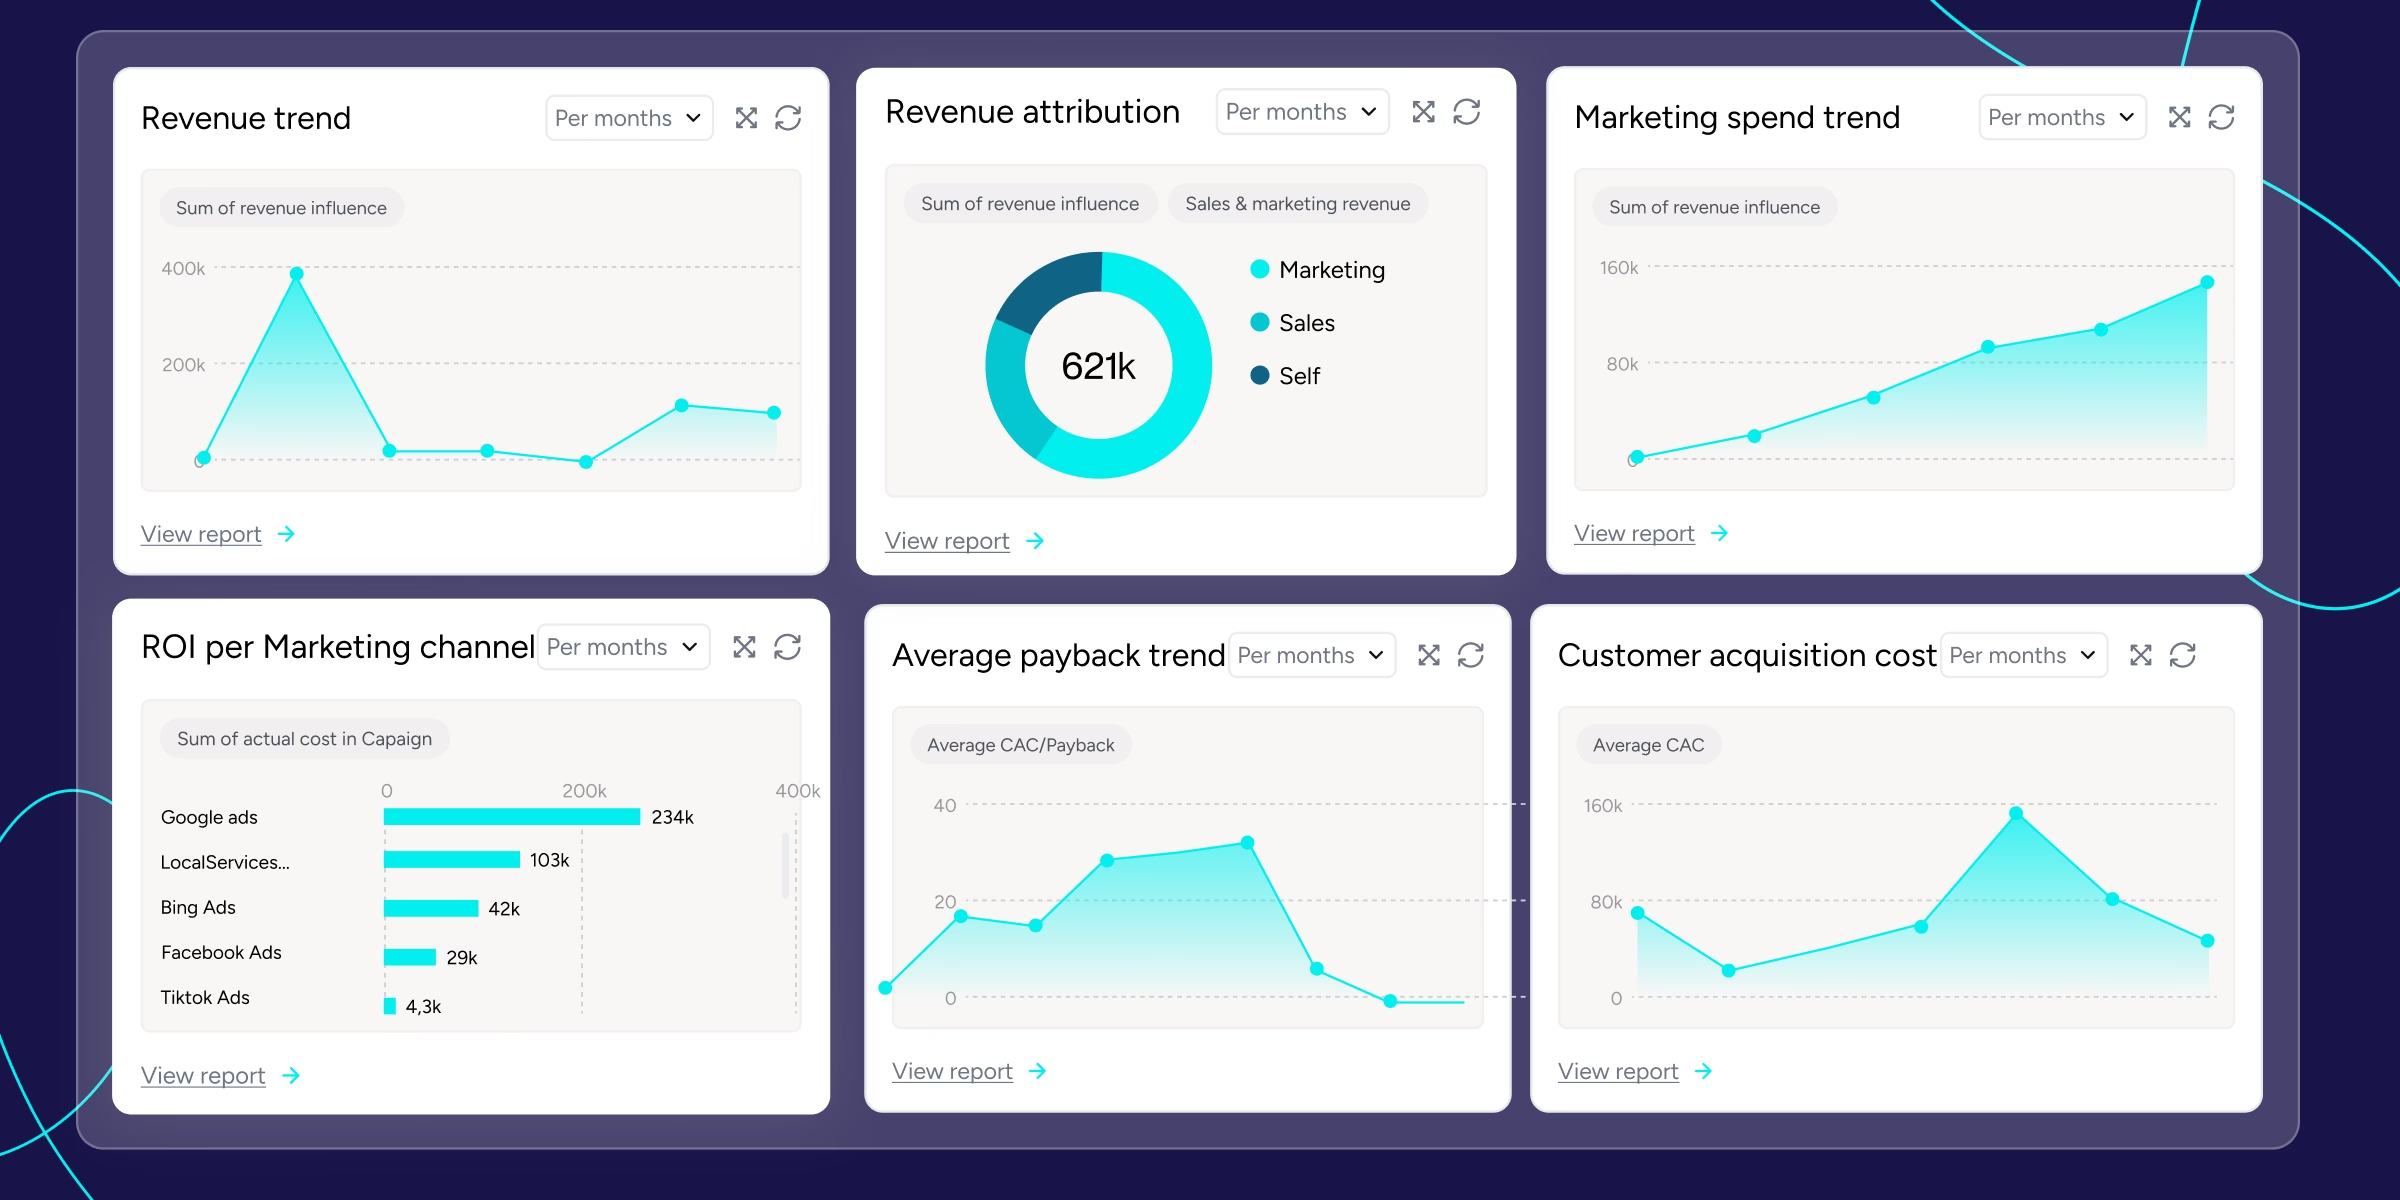
How to Build Shared Metric Dashboards
Dashboards solely align teams when everyone trusts the data and sees the same picture. A single source of truth inside the CRM eliminates the “my spreadsheet says different” problem.
1. Define Metric Ownership and Accountability
Assign clear owners to each metric while maintaining shared visibility. Marketing owns MQL volume. Sales owns SQL conversion. Both own pipeline value.
2. Standardize Data Sources and Definitions
Teams often use different definitions for the same metric. Marketing and Finance each calculate CAC differently. Confusion follows.
This is more common than most companies admit. We regularly work with teams where the marketing leader calculates CAC based only on ad spend, while Finance includes salaries and overhead. Both reports produce different numbers. Leadership loses trust in both. The fix: document calculation methods in a shared wiki, get sign-off from all stakeholders, and review definitions quarterly as your business evolves.
3. Centralize Reporting Inside Your CRM
CRM-native reporting beats external dashboards for alignment. When attribution and metrics live in Salesforce or HubSpot, both teams access the same truth without data export delays or definition drift.
This matters more than most teams realize. We’ve seen global enterprises with dozens of ad accounts, multiple CRM instances, and fragmented MarTech stacks where the data never comes together. One enterprise technology company was spending hundreds of thousands of dollars per month on Google Ads across roughly 100 accounts but had no way to connect ad performance to business outcomes because its standard CRM connectors only supported a single account. As their marketing operations lead put it: “Most people have just lived with the idea that we’re not going to do it. And I feel like that’s a mistake because we want to know if we’re spending hundreds of thousands of dollars a month on some ad, we want to know it works.”
The lesson: reporting that lives outside your CRM creates friction. Native integration means no manual imports, no data latency, and no definition drift between what marketing sees and what sales reports.
4. Establish Review Cadence and Shared Targets
Regular cross-team metric reviews create accountability. Weekly pipeline reviews catch problems early. Monthly strategic reviews adjust course.
Shared targets work better than separate marketing and sales goals. When both teams win or lose together, collaboration improves.
One useful tip from our implementation experience: start where the pain is sharpest. The teams that see the fastest alignment improvements don’t try to build every dashboard on day one. They focus on the one or two metrics causing the most arguments, usually pipeline attribution or CAC by channel, prove the value, then expand. Quarterly reviews are the right cadence for iterating on dashboards and bringing new stakeholders into the data.
Why Multi-Touch Attribution Improves SaaS B2B Metrics
You can’t align teams on metrics when you can’t agree on which activities influenced revenue. Attribution connects marketing activity to sales results with evidence rather than opinions.
Why Single-Touch Models Miss Marketing Influence
First-touch and last-touch attribution create incomplete pictures. First-touch ignores everything after initial contact. Last-touch ignores everything before the final conversion.
B2B deals involve multiple touchpoints across months. Single-touch models miss most of them, which leads to metric disputes between teams.
Consider a real scenario we encounter regularly: a prospect clicks a Google ad, visits your pricing page, downloads a case study, attends a webinar three weeks later, then books a demo after receiving a nurture email. First-touch credits Google Ads entirely. Last-touch credits the nurture email. Neither model reflects what actually happened. And when your buyer journey spans months with untracked touchpoints floating around (as one client described it), you’re making budget decisions based on a fraction of the picture.
Attribution Models That Work for Long Sales Cycles
Different models apply to different situations:
- Linear attribution: Equal credit to all touchpoints. Fair but undifferentiated.
- W-shaped attribution: Weights first touch, lead creation, and opportunity creation. Ideal for B2B.
- Time-decay: More credit to touchpoints closer to conversion. Useful for accelerating late-stage engagement.
- Custom/blended models: Combine multiple models customized to your unique sales cycle. For example, applying positional weighting with time-decay adjustments.
W-shaped often works best for B2B SaaS because it credits awareness, engagement, and conversion stages equally. But the key is that attribution should be transparent and auditable, not a black box. If you can’t explain why a campaign received a certain revenue credit, your teams won’t trust the data, and you’re back to arguing.
How to Connect Attribution to Your CRM
CRM-native attribution ties touchpoints directly to opportunities and revenue. Both teams see the same influence picture without having to export to external tools.
This is where most attribution solutions fail in practice. Many platforms require companies to export their CRM data into external environments, which creates three problems: data fragmentation, data protection concerns (especially for EU-based companies navigating GDPR), and reporting lag. When attribution data lives outside your CRM, it becomes another siloed dashboard that marketing references but sales ignores.
Solutions like Heeet take a fundamentally different approach by keeping all attribution data inside Salesforce or HubSpot as native objects. Marketing sees which campaigns influenced deals. Sales sees which content helped close them. Finance sees revenue attribution they can trust. Same data, same truth, without middleware, data extraction, or shadow databases.
The difference matters operationally: when a salesperson opens an opportunity in Salesforce and can see every marketing touchpoint that influenced the deal, both pre-acquisition and post-acquisition, the “marketing doesn’t help us close” argument disappears. When the CFO can pull a native Salesforce report showing pipeline and revenue by campaign with accurate CAC and ROI, budget conversations happen in the language of revenue impact, not vanity metrics.
The Hidden Metric Problem: What Happens After the MQL
Most metric frameworks stop tracking marketing’s influence once a lead enters the sales pipeline. This creates a massive blind spot.
In reality, marketing continues to influence deals long after the MQL handoff. A prospect who attended your webinar, received three nurture emails, and downloaded a case study before the sales call is far warmer than one who filled out a form and went dark. But if your metrics only credit the form fill, marketing gets zero credit for the nurture that actually moved the deal.
We’ve seen this blind spot cause real damage. Companies where marketing influence on sales-sourced opportunities is completely invisible end up cutting the exact campaigns that accelerate the pipeline because nobody can prove their impact.
The fix is to track influence across the full buyer journey so you can distinguish between touchpoints that occur before lead creation (pre-acquisition) and those that occur after (post-acquisition). When both types of influence are visible and attributed to revenue, you finally have a complete picture of what drives deals.
Connecting Ad Spend to Revenue: The Closed-Loop Problem
One of the most persistent metric challenges in B2B SaaS is closing the loop between what you spend on ads and what revenue those ads generate.
Here’s a practical example of why this matters. We recently analyzed our own Google Ads search query data and discovered something eye-opening: prospects who eventually converted to paying customers were searching with much more specific, problem-focused language than the keywords we were bidding on. While we targeted “marketing attribution software,” our highest-value customers were searching for things like “how to track LinkedIn ad ROI in Salesforce” and “connect Google Ads conversions to Salesforce opportunities.”
After running the search query report against revenue data, we found that roughly 20% of our ad budget was going to queries that generated zero pipeline over six months. Terms like “marketing analytics platform” drove clicks and even form fills, but never converted to opportunities.
The lesson for any B2B SaaS team: you need to connect ad spend data to revenue outcomes at the campaign, keyword, and even search query level. Generic cost metrics tell you what you’re spending. Revenue-connected metrics tell you what’s working. When you can see which specific campaigns influence closed-won deals (not just which ones generate clicks), budget decisions become obvious.
Metric Alignment Mistakes That Kill Revenue Growth
Even teams tracking the right metrics can lose alignment due to common pitfalls.
Using Different Definitions for the Same Metric
Marketing calculates CAC, including only ad spend. Finance includes salaries and overhead. Both reports give different numbers. Leadership loses trust in both.
Standardize definitions before building dashboards. Document everything. Revisit quarterly.
Tracking Activity Metrics Instead of Revenue Outcomes
Optimizing for MQLs, meetings booked, or calls made creates perverse incentives. Marketing generates low-quality leads to hit MQL targets. Sales books meetings that never convert.
Tie every activity metric to a revenue outcome. MQLs matter only if they become SQLs that close. Events matter only if they generate pipeline, although the path from event to closed deal spans months with multiple touchpoints.
Ignoring Influenced Pipeline in Attribution
“Source” attribution undervalues marketing’s impact on deals. A lead might come from a trade show, but close because of three nurture emails and a case study.
Influenced pipeline captures every touchpoint that helped close a deal. It’s a fairer picture of marketing’s contribution. And it changes how teams collaborate: when sales can see that a deal had seven marketing touchpoints before the opportunity was created, the conversation shifts from “marketing doesn’t generate pipeline” to “which campaigns should we double down on?”
Relying on Cookie-Based Tracking for Attribution Data
With browser privacy changes accelerating and third-party cookies being phased out, any attribution strategy built on traditional cookie-based tracking is on borrowed time. You’re making decisions based on an increasingly incomplete data set.
Server-side, privacy-first tracking that captures intent signals without relying on third-party cookies isn’t an optional feature anymore; it’s the foundation that makes every metric in this guide accurate. When your tracking method is cookieless and GDPR-compliant by design, you collect more data (not less) because you don't lose visibility when a browser blocks a tracking pixel.
Turn Your Metrics Into Revenue Intelligence
Metrics only align teams when everyone trusts the data and sees the same picture. Fragmented tools and conflicting definitions create the opposite effect.
Centralizing marketing intelligence inside your CRM solves this problem. When attribution, pipeline data, and revenue metrics live in Salesforce or HubSpot, both teams can work from a single source of truth. No more spreadsheet wars. No more conflicting numbers.
The companies that get this right treat alignment as an infrastructure problem, not a reporting problem. Instead of layering dashboards on top of disjointed data, they fix attribution at the data model level inside the CRM. The result: marketing is evaluated on revenue impact, not activity volume. Sales sees exactly how marketing supports their deals. And the CFO gets numbers they can actually trust.
Heeet brings all marketing intelligence into your CRM natively. Every touchpoint, including paid ads, organic content, events, webinars, and LinkedIn engagement, connects to the pipeline and revenue. Every campaign shows its true impact with transparent, auditable attribution that both teams can verify.
Ready to align your teams on revenue? Book a demo to see how CRM-native attribution creates a single source of truth for marketing and sales.
Other articles

.svg)
Êtes-vous prêt à suivre les prospects du lead à la clôture avec Heeet ?
Heet permet aux spécialistes du marketing et des ventes des entreprises informatiques et de sécurité de transformer leurs conjections en décisions éclairées qui génèrent des revenus tout en respectant les mêmes normes techniques de sécurité que celles que vous offrez à vos clients.