Read time :
Understanding Marketing-Driven Pipeline Velocity: How to Measure, Benchmark, and Improve Your Sales Cycle
Learn how to measure marketing-driven pipeline velocity, benchmark by channel, and use content, ABM, and events to speed up your B2B sales cycle.


TL;DR: Pipeline velocity measures the dollar value of revenue moving through your sales pipeline per day. The formula: (Qualified Opportunities x Average Deal Size x Win Rate) / Sales Cycle Length. Marketing controls three of the four variables. This how-to guide shows you how to measure velocity by channel, use content to accelerate conversion, create alignment on ABM targets with sales, turn events into pipeline accelerators, and build a single dashboard pinpointing performance across your entire revenue engine.
Pipeline velocity isn’t solely tied to sales, yet most pipeline velocity guides are written for sales ops. They walk through the formula and give you a few tactics to “shorten your sales cycle.”
The issue with framing it as a sales-dependent approach is that it ignores the fact that marketing controls three of the four variables in the velocity equation:
- Opportunity volume comes from demand gen.
- Deal size depends on ICP targeting.
- Win rate correlates directly with lead quality.
Only the sales cycle length is mainly in sales's hands, and even that shrinks when marketing delivers the right enablement content at the right time.
One of the reasons we built Heeet is that we lived this problem firsthand. Our experience in B2B SaaS RevOps is riddled with examples of marketing leads telling our CFO how many leads a campaign generated, but not how much pipeline or revenue it actually produced. Every time we asked for a budget to redo a trade show or increase ad spend, we were left empty-handed; we had lead counts, but no way to connect them to revenue speed. That disconnect between marketing activity, pipeline velocity and final revenue impact is what drove us to build privacy-compliant attribution that lives natively in the CRM.
Pipeline velocity measures the dollar value of revenue moving through your sales pipeline per day. The formula: (Qualified Opportunities x Average Deal Size x Win Rate) / Sales Cycle Length. It’s a single number that captures how fast your go-to-market engine converts investment into revenue.
Yet most marketing teams never track it. They report on MQLs, cost per lead, and campaign impressions. Meanwhile, the metric that connects marketing effort to revenue speed goes unmeasured.
This guide changes that. We’ll break down pipeline velocity through a marketing lens: which channels produce fast-moving pipeline, how content accelerates conversion, where ABM and events fit, and how to build a dashboard that gives marketing and sales a shared view of what’s working.
1. How Marketing Drives Pipeline, and at What Pace
Pipeline velocity measures how fast revenue moves through your sales funnel, expressed in dollars per day. The formula is: (Number of Qualified Opportunities x Average Deal Size x Win Rate) / Average Sales Cycle Length.
Put real numbers to it. Say your team generates 75 qualified opportunities per quarter with an average deal size of $12,000, a 22% win rate, and a 45-day sales cycle. Your velocity: $4,400 per day.
Now imagine the same inputs but a 90-day cycle. Velocity drops to $2,200 per day. Half. Same pipeline, same win rate, same deal size. The only difference: how long deals sit before closing.
The Compound Effect Most Teams Miss
A 10% improvement in each velocity variable doesn’t produce a 10% velocity gain. It produces a 46% increase. That’s the compound math at work: 1.1 x 1.1 x 1.1 / 0.9 = 1.46x. Small, simultaneous improvements across all four levers create outsized results, and marketing touches three of those four levers directly.
Here’s where the marketing angle matters. Each variable in the formula maps to a specific marketing function:
- Opportunity volume. Demand generation campaigns, content marketing, and paid media fill the top of the funnel. More qualified opportunities enter the pipeline when marketing targets the right audience with the right message.
- Deal size. ICP targeting and ABM strategy influence which accounts enter the funnel. Tighter targeting means larger accounts. Larger accounts mean bigger deals.
- Win rate. Lead source quality is the strongest predictor. Modern sales cycle emphasizes using shared systems, timely insights, and consistent seller behavior to speed up conversions and improve the overall buying process**.**
Content-assisted nurturing and sales enablement materials shorten the time between first touch and closed deal. Sales teams equipped with battle cards, case studies, and ROI calculators will inevitably close deals faster with their qualified leads.
Marketing doesn’t just feed the pipeline. Marketing sets the pace.
Why Pipeline Decay Matters as Much as Pipeline Creation
Not every opportunity that enters your pipeline will exit as a closed deal. Pipeline decay, the gradual loss of opportunities to inaction, competitor wins, or shifting priorities, erodes velocity silently.
Marketing’s role in combating decay: retargeting stalled opportunities with mid-funnel content, triggering re-engagement sequences when accounts go dark, and feeding sales real-time intent signals that flag when a previously cold account starts researching again. Preventing one deal from decaying is often more efficient than generating three new MQLs to replace it.
2. The Channels That Bring Leads vs. the Channels That Build Pipeline
The average MQL-to-SQL conversion rate in B2B is 13-18%, with top performers reaching 25-35%. But those averages mask a major gap: conversion rates vary wildly by channel.
A channel that generates 500 MQLs per month sounds productive. But if only 2% of those leads become SQLs that sales can work with, you’re spending budget on volume that never touches pipeline. Compare that to a channel producing 50 leads, where 51% convert to SQL. The math is clear. Volume without velocity is a cost center.
Here’s what the data shows:
Sources: First Page Sage, MarketingSherpa, HubSpot Sales Research
The pattern here is clear. Intent-driven channels (organic search, direct website visits) produce pipeline at 2-3x the rate of interruption-based channels (paid social, cold outbound). Email and webinars fall in between because they target prospects who’ve already raised their hand. For teams investing heavily in webinars, proving webinar ROI beyond attendance requires connecting attendees to downstream pipeline, not just registration numbers.
The Lead Volume Trap
Marketing teams optimizing for MQL count tend to over-invest in channels that drive volume at the expense of those that drive velocity. Paid social campaigns can fill a dashboard with leads. But if those leads stall at the MQL stage, they’re slowing your pipeline, not accelerating it.
We see this pattern constantly through our own attribution data. After running a revenue-attribution report across six months of campaigns, we found that roughly 20% of our ad budget was allocated to queries that generated zero pipeline. Not low pipeline—zero. Expressions like “marketing analytics platform” and “campaign tracking software” drove clicks and even form fills, but attribution data showed those visitors almost never converted to opportunities. The queries simply weren’t specific enough to signal buying intent. We redirected that budget toward search queries with proven revenue impact and saw pipeline contribution increase within six weeks.
This distinction matters more than ever. Organizations with strong sales and marketing alignment see 2.4x higher revenue growth and 2x higher profitability growth than misaligned teams (Forrester). Alignment starts with agreeing on which channels drive revenue, not just which ones drive lead volume.
The fix: stop measuring channels solely by lead volume. Start measuring them by pipeline contribution and velocity. Which channels produce SQLs that sales converts? Which channels generate opportunities that close within 60 days versus 120?
With CRM-native attribution, you can see exactly which channels are producing SQLs that move through the funnel, not just leads that sit in a nurture sequence. That’s the difference between real revenue attribution and a basic last-click report.
3. How Content Nurtures Qualified Leads into Sales-Ready SQLs
Content marketing impacts pipeline velocity at every stage. Not just at the top, where blog posts attract visitors. Not just at the bottom, where case studies close deals. At every step in between.
Think of content as a velocity accelerator. Each piece either moves a prospect forward or stalls them. The question isn’t whether content matters. It’s which content matters at which stage.
Three content motions that shape velocity:
Top-of-funnel: MQL creation. Blog posts, SEO content, and thought leadership attract prospects who are researching a problem. Companies with active blogs generate 67% more leads per month than those without (DemandMetric). But top-of-funnel content only affects the “opportunities” variable in the velocity formula. It fills the pipe. It doesn’t speed it up.
Mid-funnel: MQL-to-SQL conversion. This is where content has the greatest impact on velocity. Case studies, comparison pages, ROI calculators, and webinars give prospects the evidence they need to justify a sales conversation. Leads who engage with three or more content assets before talking to sales show 72% higher win rates and shorter sales cycles. Mid-funnel content accelerates two variables at once: it improves win rate and compresses cycle length.
Bottom-of-funnel: Cycle acceleration. Sales decks, battle cards, pricing guides, and implementation documentation equip your sales team to close faster. Highspot found that sales teams with structured enablement content close deals 28% faster than those winging it with custom decks and one-off emails.
Content Engagement as a Velocity Signal
Beyond driving conversions, content engagement trends predict deal speed. In our own sales process, we noticed a consistent signal: prospects who requested a demo but hadn’t visited our pricing page showed markedly lower engagement during the call, demonstrating pure curiosity with no buying urgency. Those who visited the pricing page before their demo moved through the pipeline significantly faster. When your CRM tracks which content each prospect consumed before entering the pipeline, sales can prioritize high-velocity opportunities and deprioritize tire-kickers before they slow down the funnel.
This insight matters for more than just sales prioritization. It reveals which content assets function as genuine velocity accelerators versus which ones just generate activity. A blog post with 10,000 visitors and zero pipeline movement is a vanity metric. A pricing comparison page with 200 views that appears in 40% of deals closing under 60 days is a velocity engine.
Content Velocity Mapping: A Framework
Most marketing teams can tell you which blog post generated a lead. Fewer can tell you which case study appeared in the journey of a deal that closed in 30 days versus one that took 120. That gap between lead attribution and deal attribution is where velocity insights hide.
When content engagement data lives directly on lead, account, and opportunity records inside your CRM, you can trace exactly which assets influenced deals and which ones didn’t. Our own content analysis showed that prospects who converted used far more specific, problem-focused search language than what we were targeting in ads. The highest-value customers weren’t searching for broad search terms like “marketing attribution software” — they were looking for specific pain points like “how to track ad ROI in my CRM” and “connect ad conversions to sales opportunities.” That insight didn’t come from page-view analytics. It came from connecting search queries to closed-won revenue inside the CRM.
Map every content asset to its velocity impact using this system:
Multi-touch revenue attribution closes the gap between content interaction and revenue impact. When you can trace content consumption across the full buyer journey, you see which assets accelerate deals, not just which ones attract clicks.
The tactical takeaway: Audit your content library against these three motions. If 80% of your content sits at the top of the funnel and 5% supports mid-funnel conversion, you’ve found your velocity bottleneck.
4. ABM Strategy: Targeting the Accounts Sales Wants to Sign
Account-based marketing is the highest-velocity strategy in the B2B playbook because it pre-qualifies the account before the first impression is served.
ABM-sourced deals are 171% larger than non-ABM deals, according to the ITSMA/ABM Leadership Alliance. SiriusDecisions puts the win-rate advantage at 38%. And because marketing and sales pre-align on target accounts, the sales cycle compresses by 20-30%.
Run those numbers through the velocity formula. Larger deal size. Higher win rate. Shorter cycle. Every variable except raw opportunity count improves. And the opportunities that do enter the pipeline are pre-vetted, which means fewer stalled deals clogging the forecast.
How ABM Alignment Works in Practice
- Sales identifies target accounts. They flag companies based on expansion triggers, tech stack signals, recent funding, or vertical fit. These aren’t wishlist accounts. They’re accounts where timing and fit converge.
- Marketing builds matched audience segments. Using CRM data, marketing creates segments that mirror the sales team’s target list. Firmographic filters (industry, revenue, employee count) plus behavioral signals (website visits, content engagement) narrow the audience.
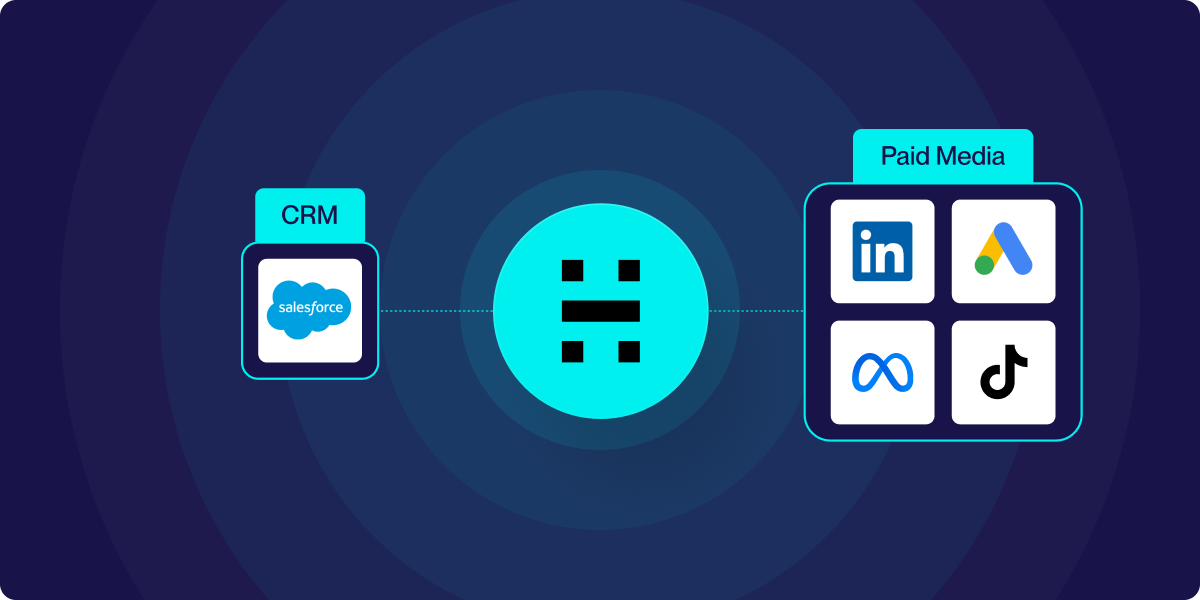
- Segments sync to ad platforms. Through CRM-native audience activation, those segments push directly to Google Ads, LinkedIn, Meta, and TikTok. No CSV exports. No stale lists. The sync is built on live CRM data, so the ad audience always reflects the current pipeline state. This also works in reverse: you can filter out existing customers and unqualified prospects from acquisition campaigns, guaranteeing every ad dollar targets accounts that sales actually want to sign.
- Engagement data flows back. When target accounts interact with ads, visit landing pages, or download content, that activity is recorded on the CRM contact and account records. Sales sees exactly who’s engaging and when.
Timing ABM Plays to Buying Windows
ABM velocity accelerates further when campaigns match real buying signals rather than arbitrary campaign schedules. Engagement scores rise when outreach coincides with actual business events: a new funding round, a leadership change, a tech stack evaluation cycle. Marketing teams using intent data to time ABM plays report pipeline velocity 2-3x higher than calendar-driven campaigns because they engage accounts during an active buying window.
The opposite of ABM is the “spray and pray” model: broad campaigns targeting generic audiences, generating thousands of leads that don’t match what sales needs. High MQL volume. Low pipeline velocity. The budget gets spent. The pipeline doesn’t move.
ABM flips that equation. Fewer leads, but every one of them is an account that sales already wants to talk to. The velocity difference is measurable within one quarter.
5. How Events Increase Sales Velocity: The Data Behind Marketing-Sales Alignment
Events are the most misunderstood channel in the velocity conversation. On paper, they look terrible. The raw MQL-to-SQL conversion rate sits at 4.2%. Cost per lead is often 5-10x higher than digital channels.
But that 4.2% number tells a misleading story. It measures events the way most teams run them: collect badge scans, dump them into the CRM, and hope sales follow up. Under those conditions, yes, events are a slow, expensive lead source.
Structured event programs tell a different story. When marketing and sales coordinate before, during, and after the event, SQL conversion rates jump to 15-25%. The gap between 4.2% and 25% isn’t the event itself. It’s the process around it.
Pre-Event: Set the Table
Marketing and sales co-select which accounts to invite. This overlaps directly with ABM strategy. The target list isn’t “everyone in the industry.” It’s “the 50 accounts sales are actively targeting, plus 30 high-fit prospects we want to open.”
Marketing creates pre-event content: teaser emails, LinkedIn sequences, and dedicated landing pages. Sales sends personalized outreach to key prospects, verifying attendance. Pre-event outreach increases booth visit rates by 3x, because attendees arrive already knowing who you are and why they should talk to you.
During the Event: Capture with Context
Lead capture must tie directly to CRM records. Not spreadsheets. Not business card bowls. When a prospect visits your booth, their interaction is logged in their existing CRM contact. If they’re new, the record creates automatically with source attribution intact.
Sales enablement materials matter here. Battle cards for competitive conversations. Demo environments configured for the prospect’s industry. ROI calculators pre-loaded with industry benchmarks. Case study handouts matched to vertical. Every conversation at the booth should feel tailored, because it is.
Post-Event: Speed Wins
Gong’s research shows that following up within one business day cuts deal duration by 11% (Gong Labs research). That’s not a marginal improvement. On an 84-day SaaS sales cycle, 11% shaves off nine days per deal.
The missing piece in most event programs is the mechanics of attribution. When a prospect visits your booth, that interaction needs to flow into their CRM record as a trackable influence, not just a badge scan in a spreadsheet. With CRM-native attribution, post-acquisition event interactions automatically create a new influence on existing opportunities. If you meet a prospect at a conference and they already have an open deal, the event touchpoint is attributed to that deal’s revenue under your attribution model. Events get credit proportional to their actual pipeline influence, not just the number of badge scans collected. When combined with offline conversion tracking, event interactions flow back to your ad platforms too so that Google Ads can optimize for actual pipeline, not just registrations.
The post-event sequence should be segmented by engagement level. A prospect who attended your session and visited the booth gets a different follow-up than someone whose badge was scanned in passing. Hot leads (session + booth + demo request) go directly to sales with a personalized recap deck. Warm leads (badge scan, brief conversation) enter a content nurture sequence tied to the event topic.
Structured post-event follow-up takes that 4.2% SQL rate and pushes it to 15-25%. The event didn’t change. The process did.
The Enablement Stack for Events
Events only accelerate pipeline velocity when marketing and sales agree on three things before the event starts: who to target, what to say, and how to follow up. Without that alignment, events are expensive lead generation. With it, they’re a velocity multiplier.
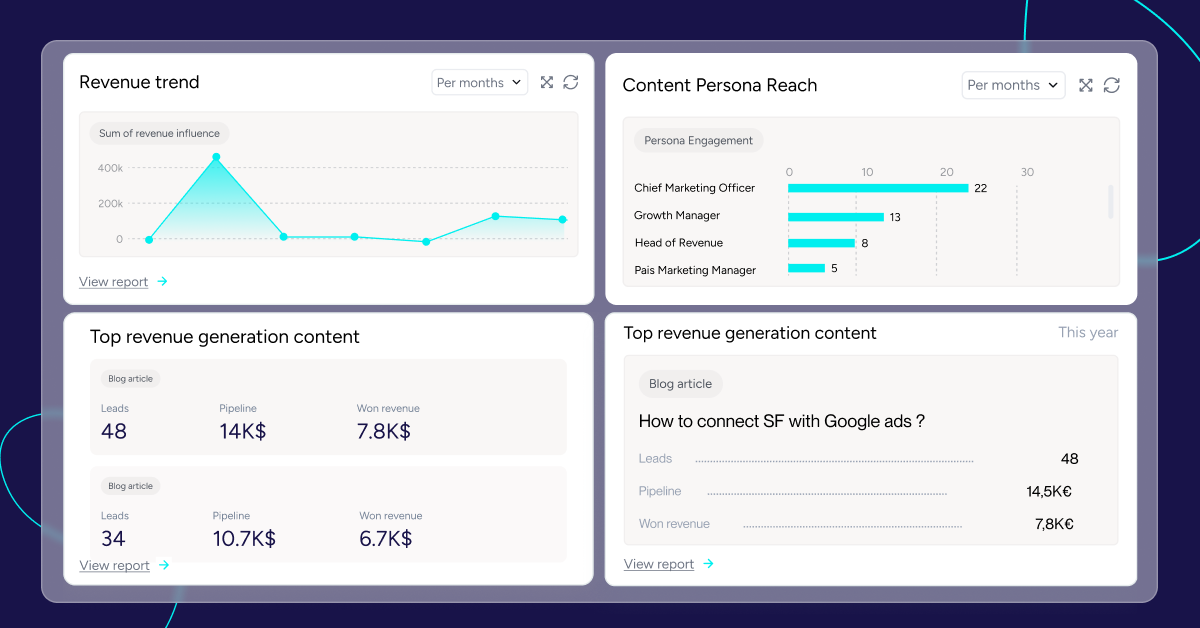
6. Building a Pipeline Velocity Dashboard: The Metrics That Matter
A pipeline velocity dashboard gives marketing and sales a shared view of pipeline health. Not two separate dashboards. Not a marketing report and a sales report that never agree. One view, with one set of numbers, tracking the same outcomes.
This matters more than most teams realize. Companies with weekly pipeline velocity tracking achieve 34% revenue growth versus 11% for those with irregular tracking, plus 87% forecast accuracy versus 52% (First Page Sage, 2025). The act of measuring velocity consistently changes behavior.
Gartner projects that by 2026, 75% of the highest-growth companies will have adopted a RevOps model, up from roughly 30% today. A shared velocity dashboard is the operational backbone of that model.
Here’s how to organize it.
Primary Velocity Metrics
These belong at the top of the dashboard. They’re the numbers your CMO and VP of Sales review weekly.
Events only accelerate pipeline velocity when marketing and sales agree on three things before the event starts: who to target, what to say, and how to follow up. Without that alignment, events are expensive lead generation. With it, they’re a velocity multiplier.
6. Building a Pipeline Velocity Dashboard: The Metrics That Matter
A pipeline velocity dashboard gives marketing and sales a shared view of pipeline health. Not two separate dashboards. Not a marketing report and a sales report that never agree. One view, with one set of numbers, tracking the same outcomes.
This matters more than most teams realize. Companies with weekly pipeline velocity tracking achieve 34% revenue growth versus 11% for those with irregular tracking, plus 87% forecast accuracy versus 52% (First Page Sage, 2025). The act of measuring velocity consistently changes behavior.
Gartner projects that by 2026, 75% of the highest-growth companies will have adopted a RevOps model, up from roughly 30% today. A shared velocity dashboard is the operational backbone of that model.
Here’s how to organize it.
Primary Velocity Metrics
These belong at the top of the dashboard. They’re the numbers your CMO and VP of Sales review weekly.
A velocity dashboard should also track the link between sales and marketing touchpoints. How many marketing touches and how many sales interactions does it take to close a deal? What’s the average number of days from the first website visit to closed revenue? These metrics, tracked by channel and campaign, reveal not just which sources generate pipeline, but which ones create the fastest path to revenue. When both marketing and sales influences are stored on the same opportunity record in the CRM, both teams see the same data, and the “your leads are garbage” versus “sales doesn’t follow up” debate dies because the numbers are auditable.
Channel-Level Metrics
These sit in the second tier. They answer the question: “Which marketing investments produce a fast-moving pipeline?”
Trend Metrics
These track direction over time. A single velocity snapshot means nothing without context.
- Velocity trend (monthly and quarterly). Is pipeline speeding up or slowing down?
- Win rate trend by lead source. Are certain channels degrading in quality?
- Cycle length trend by deal size tier. Are enterprise deals getting longer while SMB deals compress?
- Pipeline coverage ratio. Total pipeline divided by quota target. Benchmark: 3-4x coverage for a healthy forecast.
- Pipeline decay rate. Percentage of pipeline value lost per quarter to closed-lost, stalled, or aged-out deals. Track this alongside creation rate to measure net pipeline health.
Benchmarking by Segment
One velocity number for the entire company hides more than it reveals. Break it down:
- SMB (deals under $25K): Expect 30-45 day cycles, higher win rates (26%+), faster velocity per deal, but lower absolute dollars.
- Mid-Market ($25K-$100K): Cycles stretch to 60-90 days. More decision-makers involved. Content and enablement have the biggest impact here.
- Enterprise ($100K+): Cycles of 120-180 days are normal. ABM and events become the primary velocity levers.
Organizations compressing their sales cycles to 30-45 days achieve 38% higher velocity, though this often comes with smaller average deal sizes. The tradeoff is intentional: faster turns compound over time.
The dashboard trap to avoid: building a dashboard that shows only lagging indicators. If you’re only looking at closed-won velocity, you’re seeing last quarter’s story. Add leading indicators, like pipeline creation rate, MQL volume trend, and content engagement velocity, to predict next quarter’s performance.
With Salesforce marketing attribution, this dashboard lives natively in the CRM. No BI tool dependencies. No data warehouse syncs that break on weekends. Marketing and sales look at the same data in the system they already use every day.
7. Turning Velocity Data into Marketing-Sales Alignment
Velocity data becomes the shared language that stops the “marketing sends junk leads” and “sales doesn’t follow up” argument. When both teams look at the same pipeline velocity numbers by channel, content type, and campaign, finger-pointing gives way to pattern recognition. If you’ve experienced this conflict firsthand, understanding why sales and marketing fight over attribution reveals how RevOps can fix it.
Companies with high alignment across customer-facing functions see 2.4x higher revenue growth and 2x higher profitability growth (Forrester). Alignment also leads to a 38% higher sales win rate. These aren’t marginal gains. They’re the difference between meeting and missing revenue targets.
Start With an Alignment Audit
Before building dashboards or reallocating budget, run a simple alignment check. Ask both marketing and sales these four questions:
- How do you define “pipeline generated by marketing”?
- What makes a lead sales-qualified?
- Should marketing get credit for opportunities that sales sourced?
- How should we measure marketing’s revenue contribution?
Compare answers. Where definitions diverge, you’ve found your alignment gaps—and those gaps are where velocity leaks. One common disconnect we see repeatedly: if marketing thinks the sales cycle is 60 days but sales experiences 120 days, you’ll pick the wrong attribution model, and the velocity data will look broken from day one. Your attribution window, your benchmark targets, and your content strategy all depend on both teams sharing the same reality about how long deals actually take to close.
Three alignment plays emerge from velocity data:
Play 1: Channel Reallocation
Pull your velocity-by-channel report. If organic search generates $2,100/day in velocity and paid social produces $400/day on comparable spend, the reallocation case writes itself. Shift 20% of the underperforming channel’s budget to the high-velocity channel and measure the impact over 90 days.
This is where granular attribution pays off. When you can connect individual search queries to pipeline outcomes, you find spend that looks productive on the surface but generates nothing downstream. Broad, category-level keywords often drive clicks and form fills without converting to opportunities — whereas specific, problem-focused queries quietly generate most of your revenue. The fix isn’t to cut paid search; it’s to reallocate within it, shifting budget from generic terms to the search queries your closed-won customers actually used. For a step-by-step approach, see how activating CRM data to optimize ad spend turns attribution data into budget decisions.
Play 2: Content Strategy by Velocity Impact
Map content consumption to deal speed. Which blog posts, case studies, and webinars appear in the journeys of deals that closed in under 60 days? Which content shows up in deals that stalled for 120+ days or went dark?
Double down on formats that accelerate mid-funnel conversion: comparison pages, ROI calculators, and industry-specific case studies. Deprioritize content that generates MQLs but doesn’t push them toward SQL. A blog post that attracts 10,000 visitors but produces zero pipeline movement isn’t a content asset. It’s a traffic vanity metric.
Play 3: Event Strategy by Pipeline Impact
Score every event your team attends or sponsors against three velocity metrics:
- Post-event SQL conversion rate
- Average deal size of event-sourced pipeline
- Cycle length of event-sourced deals versus non-event pipeline
If a conference produces large deals that close faster than your average, increase your investment. If another event generates badge scans that never convert, cut it from next year’s calendar. Quarterly event retrospectives with shared marketing-sales ownership prevent the “we’ve always sponsored that event” inertia.
The Alignment Meeting Cadence
Velocity data works best with a regular review rhythm:
- Weekly (15 min): Pipeline velocity standup. Velocity trend, stuck deals, and any marketing support sales needs this week.
- Monthly (60 min): Channel velocity review. Which channels are accelerating or decelerating? Budget shift proposals go on the table.
- Quarterly (half-day): Velocity retrospective. Full-cycle analysis, campaign association review, event ROI audit, and strategy changes for the next quarter.
The flywheel is simple. Better attribution data feeds smarter budget allocation. Smarter allocation produces higher velocity. Higher velocity generates more closed revenue. More revenue justifies deeper investment in the channels and content that work. Each cycle compounds.
Key Takeaways
- Pipeline velocity formula: (Qualified Opportunities x Average Deal Size x Win Rate) / Sales Cycle Length = revenue per day flowing through your pipeline.
- Marketing controls 3 of 4 levers. Opportunity volume, deal size (via ICP/ABM targeting), and win rate (via lead quality and content). Even cycle length shrinks with the right enablement.
- A 10% improvement in each variable compounds to a 46% increase in velocity. Small, simultaneous gains across all four levers outperform dramatic improvement in any single one.
- Channel selection is a velocity decision. Organic search converts MQLs to SQLs at a 51% rate. Outbound converts at 1-3%. Where you invest the budget directly determines pipeline speed.
- ABM deals are 171% larger with 38% higher win rates and 20-30% shorter cycles. Pre-qualifying accounts before the first impression compresses every stage.
- Structured events convert at a 15-25% SQL rate, compared with 4.2% for unstructured approaches. The difference is in the process, not the event itself.
- Weekly velocity tracking drives 34% revenue growth versus 11% for ad-hoc measurement. Consistency in measurement changes behavior.
- Aligned organizations grow at 20% annually and see 2.4x higher revenue growth. Velocity data is the shared language that enables operational alignment.
Other articles

.svg)
Êtes-vous prêt à suivre les prospects du lead à la clôture avec Heeet ?
Heet permet aux spécialistes du marketing et des ventes des entreprises informatiques et de sécurité de transformer leurs conjections en décisions éclairées qui génèrent des revenus tout en respectant les mêmes normes techniques de sécurité que celles que vous offrez à vos clients.