Read time :
Event Marketing Attribution: How to Measure the ROI of Physical Events, Trade Shows & Conferences
This article explains how to link revenue to physical events such as conferences, trade shows, and summits, which remain essential in B2B. You'll find a step-by-step guide to measuring event marketing ROI, from badge scans to closed deals in your CRM.


After a busy first quarter packed with events, one of the top questions we heard from booth visitors was, "How are you handling attribution for this event?" Every marketer is thinking about this. That’s why we wrote this article.
When we asked them that same question, the same recurring scenario came about: Imagine you spent $150,000 on a trade show booth last quarter. Your team collected 200 badge scans over three days, distributed branded water bottles, and hosted a popular conference. At the end of the quarter, your CRO asks in the QBR, “What pipeline did we generate from that event?”
There’s usually silence. The attribution window is too short, and your CRM and tracking tools aren’t configured to capture events properly.
Currently, all you have left to show is a CRM list with attendees and the sales interaction you're hoping the team logged post-event. The disconnect with revenue is hurting your event ROI and future allocation.
The issue isn’t whether events work. B2B marketers already understand the link between events and revenue. The real problem is that the journey from badge scan to closed deal is long, complicated, and manual, and most attribution systems can’t track it. Solving this requires a clear CRM workflow, not just another analytics tool.
What Is Physical Event Attribution?
Physical event attribution is the process of connecting in-person marketing activities (such as trade shows, conferences, field events, dinners, and workshops) to measurable business outcomes in your CRM. Measurable business outcomes refer to tracked metrics such as pipeline, opportunities, and closed-won revenue.
The definition is simple, but putting it into practice is much harder.
Digital attribution tracks clicks, page views, and form fills, leaving a clear trail in your analytics. Physical events are different. If your sales rep has a 20-minute conversation at the booth, there’s no automatic record. If a prospect attends your session and then visits a competitor, there’s no digital path to follow. Data collection is manual, inconsistent, and often delayed.
Why does this matter now? In-person events are back, and there’s real excitement. After years of virtual fatigue, B2B events have surged. The Center for Exhibition Industry Research (CEIR) says trade show attendance reached 97% of 2019 levels by late 2024. In 2026, AI fatigue is a new lever driving sincere interaction. People will want real, in-person connections. Companies are investing, but there’s more scrutiny than ever. Marketing budgets are tight, and just saying "we think the event went well" isn’t enough for your CRO or finance team.
The gap between event attendance and measurement is really a CRM data issue. Fix the data, and you fix the attribution problem.
Why Measuring Physical Event ROI Breaks Most Attribution Models
Attribution tools are built for digital channels above all else. In this context, attribution models are frameworks or systems that assign credit for revenue to different marketing touchpoints, such as clicks, impressions, and conversions. Physical events challenge those tools in six specific ways.
1. The Offline Gap
In-person interactions leave no digital trail. Your best sales conversation at Dreamforce won’t appear in Google Analytics. A prospect who watched your keynote, visited your booth twice, and shook hands with your CEO has zero touchpoints in your attribution model unless someone manually logs them. The default state of event data is “missing” if no one takes the time to write it down and log it in a CRM afterward.
2. Long B2B Sales Cycles
The B2B deal cycle runs from 3 to 9 months, and often longer, depending on the sector. A contact you met at a January trade show might not enter your pipeline until April and won’t close until August. By then, your marketing team has run dozens of campaigns. Connecting that closed deal back to the January handshake requires an attribution window most teams never configure.
3. Multi-Touch Complexity
Nobody buys B2B software after just one booth visit. The trade show is one touchpoint among many: website visits, content downloads, webinars, sales calls, and email sequences. Giving the event 100% credit overstates its impact. Giving it 0% because it wasn’t the last touch before opportunity creation understates it. Find the right balance with a model that includes offline touches. Most teams don’t use one.
4. Data Silos
Your event platform (Splash, Bizzabo, Cvent) stores attendee data. Your badge scanner exports a CSV. Your CRM holds contact and opportunity records. These systems don’t talk to each other by default. The result: event data sits in one silo while pipeline data sits in another, and the two never connect. Without the right integrations between event platforms and CRMs, attribution remains a key barrier to error-free data entry at scale. While large platforms offer integrations, not every team has the budget to adopt event management software.
5. Inconsistent Data Capture
At trade shows, some reps scan every badge; others forget the scanner. Some log detailed CRM notes that evening; others do nothing. This inconsistency leaves event data incomplete. You measure a sample skewed toward your most disciplined reps.
6. Delayed Pipeline Creation
Not every event lead turns into a CRM opportunity the following week. Many contacts need nurturing for weeks or months. If your attribution system only looks at pipelines created within 14 days of the event, you’ll miss 60-70% of the event’s true influence. The pipeline is real; your measurement window is too short.
Attribution Models for Physical Events
The attribution model you choose affects how much credit your events get. Here’s how each model works in a real scenario.
The scenario: Sarah, a VP of Operations at a mid-market SaaS company, first encountered your brand at a trade show in March. She visits your booth, watches a demo, and your rep scans her badge. In April, she downloads a whitepaper from your website (UTM-tagged from a LinkedIn ad). In May, an SDR books a discovery call. In June, the opportunity is created. In August, the deal closes for $85,000.
First-Touch Attribution
In this model, the trade show gets all $85,000 in credit because it was Sarah’s first interaction with your brand. This approach is generous to events—maybe too generous. It ignores the LinkedIn ad, the whitepaper, the SDR call, and months of sales work. First-touch is easy to use but doesn’t show the full picture.
Last-Touch Attribution
The SDR’s discovery call (or whatever touchpoint happened right before the opportunity was created) gets 100% credit. The trade show gets nothing. For event marketers, this is the worst model. Events almost never sit at the bottom of the funnel. Last-touch systematically undervalues awareness-stage activities.
Linear Attribution
With linear attribution, every touchpoint gets an equal share. If there are four (trade show, LinkedIn ad, whitepaper download, SDR call), each gets $21,250. This model is fair but doesn’t reflect reality—a 20-minute conversation isn’t the same as a LinkedIn impression.
U and W-Shaped Attribution
Credit concentrates, depending on the model, at two or three key moments:
- W-Shaped splits credit so the first touch (the first time the prospect interacts with your brand, such as a booth visit) gets one third (30%), lead creation (the point where the prospect is formally identified as a lead) another 30%, and opportunity creation (when the lead becomes a sales opportunity) another 30%; the remaining 10% is split among other touches.
- U-Shaped gives 40% of the credit to the first and last touches and divies up what’s left to all the touches in between.
No attribution model is perfect. But if the trade show is the first touch, it gets significant credit in both U and W-shaped models. These approaches work well for most B2B event marketing teams with long sales cycles. They recognize the event’s role in starting the relationship and also give credit to later steps that moved the deal forward.
Custom/Weighted Attribution
In this model, you assign different weights based on how engaged someone was. For example, a booth visit might count for 10%, while a one-on-one meeting with a sales rep could count for 25%. This approach takes more setup but captures what others miss: not all event interactions are equal. A badge scan isn’t the same as a 30-minute product demo.
Model Comparison
If you’re measuring event ROI for the first time, the U or W-shaped model usually offers the best mix of accuracy and simplicity. These models give events fair credit for starting relationships without giving them too much weight.
The Event-to-Pipeline Attribution Workflow
This section shows the difference between teams that just run events and those that can prove events generate revenue. There are five key steps. Here’s the process we use at Heeet for event attribution in Salesforce.
Step 1: Pre-Event: Set Up Your CRM Campaign
Before you book any flights, set up a dedicated Campaign in Salesforce, HubSpot, or your CRM for the event. This will hold all your event data. Don’t skip this step—teams that create campaigns after the event lose data they can’t get back.
Campaign hierarchy structure Example :
- Parent Campaign: Annual Event Program (e.g., “2026 Trade Shows”)
- Child Campaign: Individual Event (e.g., “SaaStr Annual 2026”)
- Sub-Campaign (optional): Specific Activities (e.g., “SaaStr 2026: Booth Meetings” or “SaaStr 2026: Happy Hour”)
Campaign Member statuses should map to engagement depth, not just attendance:
Don't stop at just marking “Attended,” that’s not enough. A badge scan only shows someone walked by. “Met with Rep” means there was a real conversation. “Requested Demo” shows real interest. These details separate vanity metrics from real pipeline signals.
Pre-event to-dos:
- Create the Campaign and set the start/end dates
- Define your member statuses (get sales buy-in on the definitions)
- Pre-load your target account contacts as “Invited” members
- Set up Campaign Influence rules; this varies depending on your CRM (more on this in Step 4)
- Brief your booth team on how each status should be assigned
Step 2: At the Event: Capture Leads Consistently
The quality of your data at the event affects everything that comes after. If you don’t capture data well, your attribution results won’t be accurate.
Badge scanning is the minimum viable capture method. Every event platform (Cvent LeadCapture, Bizzabo, Akkroo/Integrate) offers it. The data typically includes a name, email address, company, and title. That’s enough to match CRM records. Make scanning required for every booth visitor. Go the extra mile if you have to, and print cards with the scanning instructions for your team. It sounds excessive, but we can assure you it prevents the “I forgot how to use the app” excuse and unread Slack messages in the event channel.
If QR codes are your thing, place them on collateral to provide a secondary capture path. Place QR codes on your booth materials that link to a UTM-tagged landing page with a short form. Some swear by them as a best practice that captures visitors who stop by when your reps are busy.
Mobile forms (via HubSpot, Typeform, or a custom form) are your backup. For events where badge scanning isn’t available or for meetings at the hotel bar after hours, a quick mobile form lets your reps log contacts in real time.
Session tracking matters for conferences where you’re speaking. If you’re hosting a breakout session or workshop, get the attendee list from the event organizer. That list becomes Campaign Members with an “Attended Session” status.
The key rule: capture how engaged each visitor was, not just their contact info. Train your reps to update the Campaign Member status based on what actually happened. “Scanned badge” is not the same as “had a 15-minute product conversation” or “prospect asked for pricing.” Set up a simple workflow: scan the badge, choose the right status, and add a quick note. It might feel like extra work, but it saves time later and keeps details from getting lost.
Step 3: Post-Event: Match Leads to CRM Records
Most attribution data is lost within 48 hours of an event. Here’s how to keep that from happening.
Deduplicate before you import. Export your badge scan data and match it against existing CRM contacts before creating new records. If Sarah of Acme Corp is already in your CRM with a different email, you don’t want to create a duplicate. Use email as the primary match key, then company name and last name as fallbacks.
Set Campaign Member statuses automatically. If your badge scan data doesn’t show engagement depth (which is common), use a tiered method. Bulk-update all scanned contacts to “Visited Booth.” Then, have your reps manually update those they spoke with to “Met with Rep” or “Requested Demo.” Give them a 48-hour deadline—after that, memories fade and data quality drops. This is where using a mobile form really helps.
Enrich your records. Fill in missing fields like title, company size, and industry from your data enrichment tools (Clearbit, ZoomInfo, Apollo). Clean data now means better segmentation and follow-up later.
Assign to nurture or sales sequences. The “Requested Demo” route contacts AEs directly. Route “Visited Booth” contacts into a post-event nurture sequence. Route “Attended” contacts (who didn’t visit your booth) into a softer awareness sequence. Speed matters when trying to stay top of mind after an event.
Step 4: Attribution: Connect Events to Pipeline
This is the point where your data begins to show the impact on revenue.
Campaign Influence (in Salesforce) is the mechanism that connects Campaign Members to Opportunities. When a Contact who’s a member of your trade show Campaign is associated with an Opportunity, Salesforce creates a Campaign Influence record. This is the link between “attended event” and “generated pipeline.”
Configure your Campaign Influence settings:
- Attribution window: Depending on your sales cycle, set it to at least 90 days. B2B deals don’t close in two weeks. A 14-day window will miss the majority of event-influenced pipeline.
- Model: Choose your attribution model. Again, this is based on your unique buyer journey. If you need more depth to choose the right model, you can read our guide.
- Auto-association: Enable auto-association so that Salesforce automatically creates influence records when Campaign Members are added to Opportunities.
- Event-sourced vs. event-influenced pipeline: These are two different metrics, and conflating them will get you in trouble with your finance team.
- Event-sourced pipeline: Opportunities where the event was the first touchpoint. The relationship started at the event. This is the purest measure of event ROI, but it’s also the smallest number.
- Event-influenced pipeline: Opportunities where the event was one of the touchpoints in the buyer’s journey, but not necessarily the first. This captures re-engagement: a prospect who was already in your CRM but became active again after meeting your team at a conference.
Report both metrics. Event-sourced pipeline shows what new business the event created. Event-influenced pipeline shows what existing deals the event helped move forward.
This is where attribution breaks for most teams. The event data sits in one system; the pipeline data sits in another. Campaign Influence connects them inside Salesforce, but only if the CRM Campaign was set up correctly, the contacts were matched, and the statuses were assigned. Skip any of those steps, and the link between event and pipeline dissolves. Heeet picks up this thread by automating the connection between event campaign membership and revenue data, so your team can see which events sourced and influenced pipeline without manual data joins or spreadsheet wrangling.
Step 5: Measure: Calculate Event ROI
The formula is simple:
Event ROI = (Revenue Attributed to Event - Total Event Cost) / Total Event Cost x 100
The math is easy. The challenge is figuring out what numbers to use.
Total Event Cost should include everything:
- Booth space and design/build
- Travel and accommodation for your team
- Sponsorship fees
- Swag and printed materials
- Pre-event outreach costs (ads, email, direct mail)
- Staff time (calculate at fully loaded hourly rate)
- Post-event follow-up costs (SDR time, nurture campaign spend)
Most teams underestimate costs by 30-40% because they leave out staff time and pre- or post-event marketing spend. Be honest about the full cost, or your ROI will look better than it really is.
Revenue Attribution depends on your model and timeframe:
- At 30 days post-event, report event-sourced pipeline created
- At 90 days, report event-sourced + event-influenced pipeline
- At 6 months, report closed-won revenue attributed to the event
Benchmarks to calibrate your expectations:
These benchmarks come from aggregated B2B SaaS data across sector reports (Forrester, SiriusDecisions, Bizzabo). Your numbers will vary by deal size, industry, and event type. A $5,000 regional meetup should be held to different standards than a $200,000 global conference sponsorship.
Key Metrics for Physical Event Attribution
Track these seven metrics to build a full picture of your event’s revenue impact.
A quick note on lead counts versus pipeline value: Many teams say, “We collected 200 leads at the event,” and call it a win. But that number means nothing without pipeline context. If 200 leads bring in $0, that’s a failure. If 50 leads generate $500,000, that’s a win. Always connect your event metrics to revenue.
Speed to Pipeline is an often-overlooked metric. If your trade show leads take 90 days to become opportunities but your webinar leads take only 30, that says more about your follow-up process than about the event itself.
Engagement-to-Meeting Rate shows how effective your booth team is. If 300 people visit your booth but only 15 have real conversations, that’s a 5% rate. This points to a booth experience or staffing issue, not a lack of traffic. Track this over time to spot trends.
How to Set Up Event Attribution in Salesforce
Salesforce is where most B2B event attribution lives or dies. Here’s how to configure it correctly.
Campaign Hierarchy
Use a three-level hierarchy to organize your events:
- Program-Level Parent Campaign: “2026 Events Program” (Campaign Type: Marketing Program). This rolls up all the event pipeline and spending for the year. Your CMO’s annual event ROI number comes from here.
- Event-Level Child Campaign: “SaaStr Annual 2026” (Campaign Type: Conference). Contains all members for this specific event. Cost and pipeline report at this level for individual event ROI.
- Activity-Level Sub-Campaigns (optional): “SaaStr 2026: Keynote Session,” “SaaStr 2026: Booth,” “SaaStr 2026: VIP Dinner.” Use these when comparing the ROI of different activities within the same event.
Campaign Member Status Mapping
Your statuses should reflect engagement depth, not logistics. Here’s a recommended set:
Mark “Responded” as Yes for all statuses from “Attended” and beyond. This is important because Campaign Influence only counts members with a “Responded” status. If you don’t flag statuses correctly, Salesforce won’t create influence records, and your event attribution data will be missing.
Campaign Influence Configuration
Salesforce offers two flavours of Campaign Influence:
- Campaign Influence 1.0 (First Touch): Assigns 100% credit to the Primary Campaign Source on the Opportunity. Simple but limited. Only one campaign gets credit per deal.
- Customizable Campaign Influence (Multi-Touch): Allows multiple campaigns to share credit on a single Opportunity. This is what you want for event attribution. Enable it under Setup > Campaign Influence Settings.
With Customizable Campaign Influence enabled, you can create attribution models that split credit across events, webinars, paid campaigns, and content downloads. Configure a default model and add custom models for comparison. Most teams start with a linear split, then graduate to a U or W-Shaped model as their data matures.
Reporting: Event-Sourced vs. Event-Influenced
Build two core reports:
Event-Sourced Pipeline Report: Filter Opportunities where the Primary Campaign Source equals your event campaign. This shows the pipeline that originated at the event.
Event-Influenced Pipeline Report: Use Campaign Influence records to show all Opportunities where your event campaign has any influence. Filter by Campaign name and sum the attributed revenue by model.
Most teams run into a problem here: Salesforce’s built-in Campaign Influence reports are limited. To connect Campaign Influence with Opportunity fields, Account data, and Contact engagement, you need custom report types or a tool that brings this data together. Heeet does this in Salesforce, linking event-campaign membership to revenue attribution across the buyer journey, so your team doesn’t have to build pivot tables in Google Sheets.
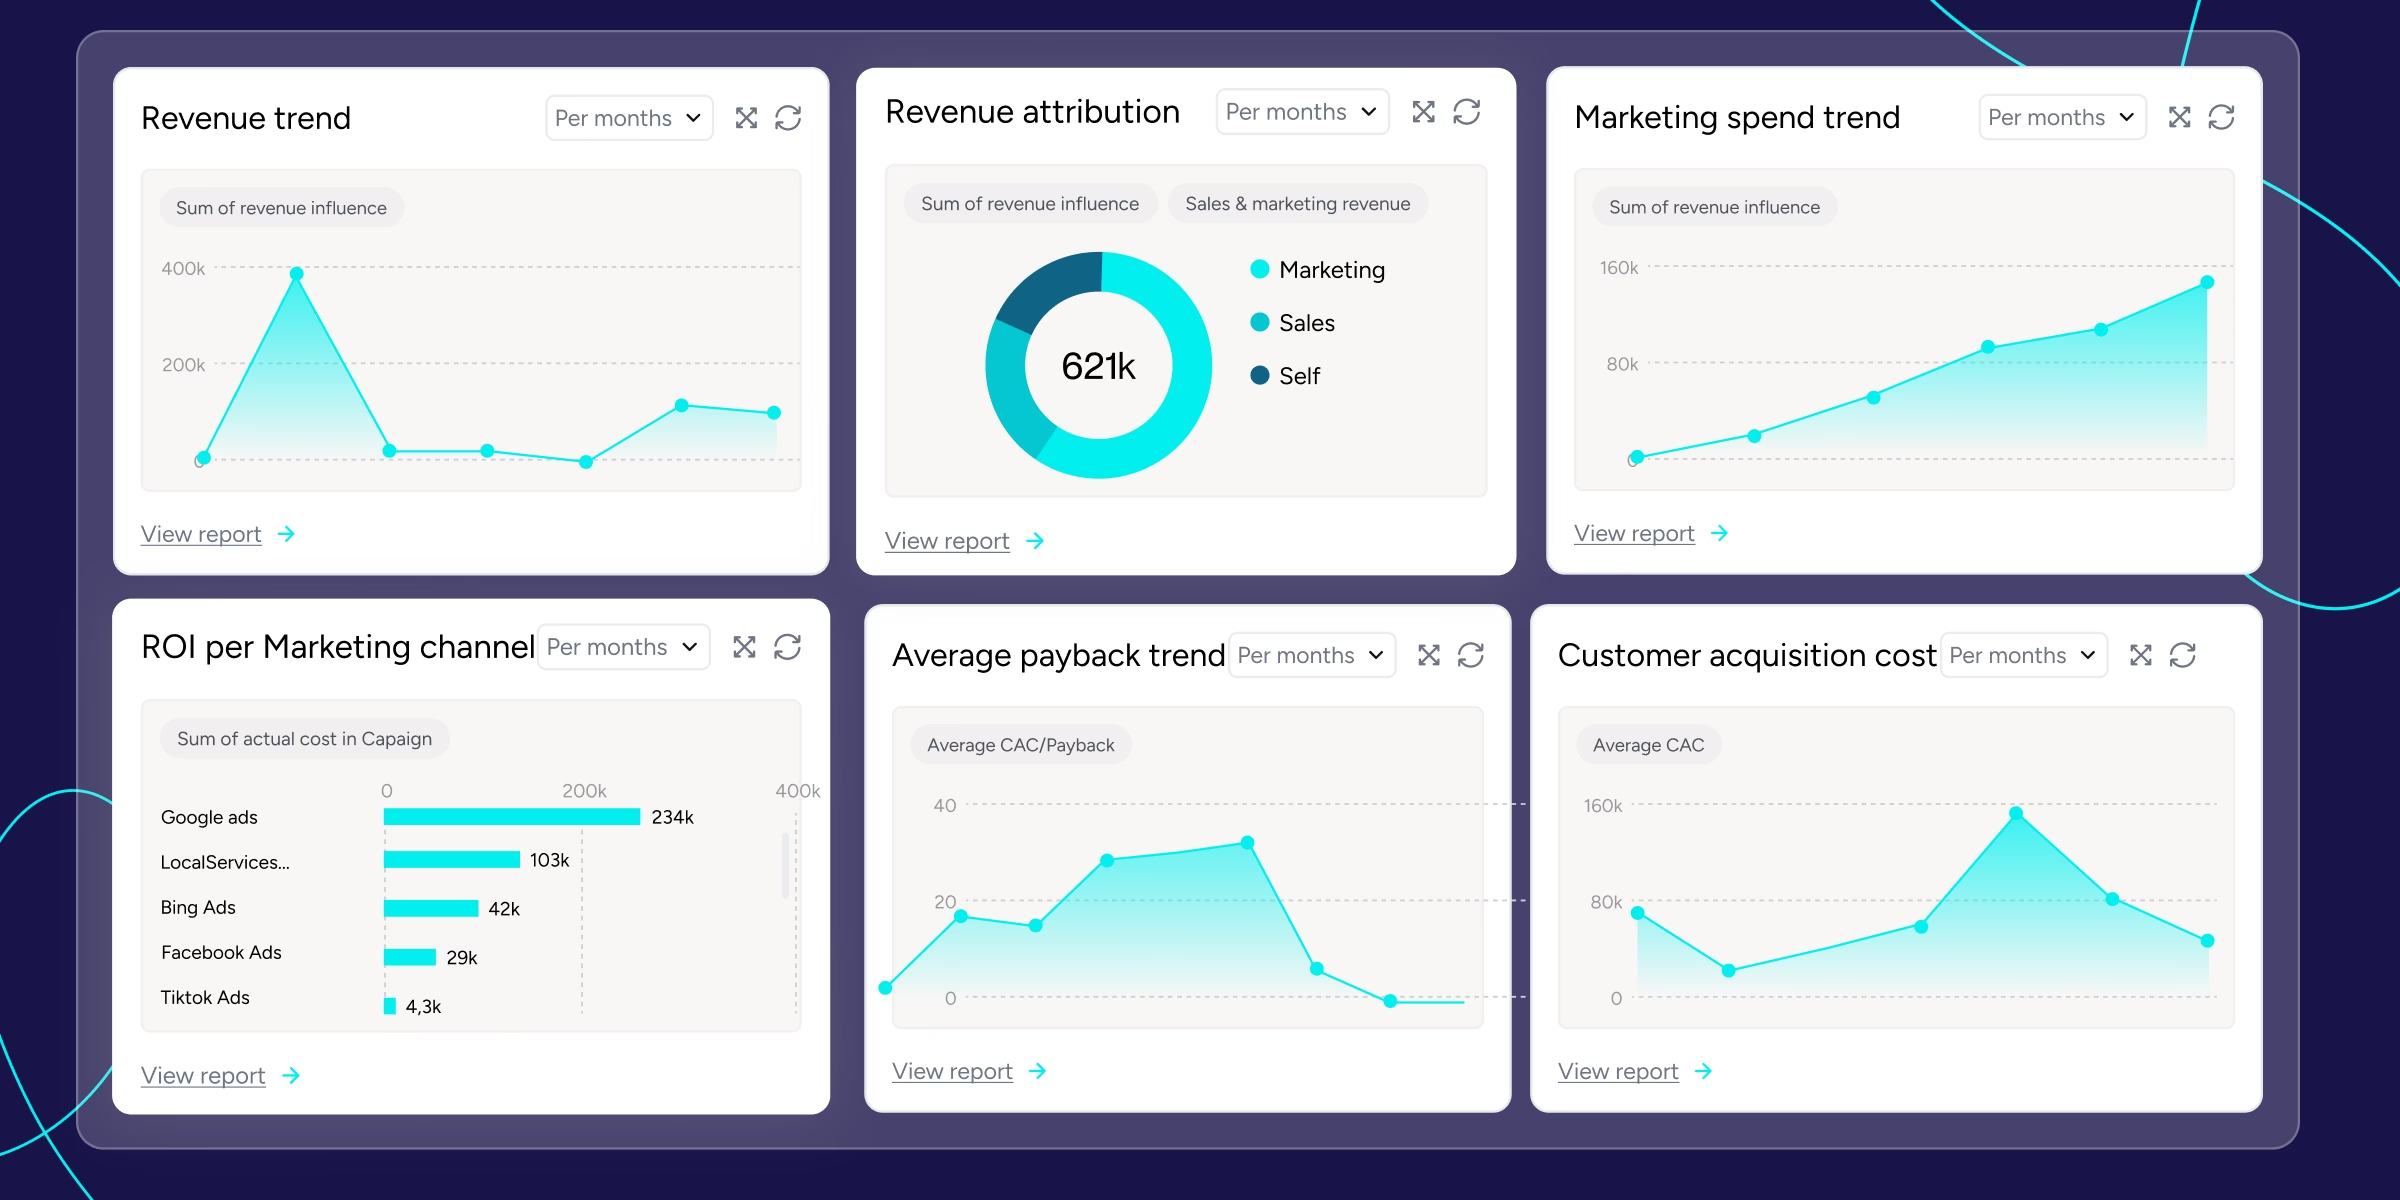
Add a dashboard with these four components:
- Event-Sourced Pipeline by Event (bar chart)
- Event-Influenced Pipeline by Event (bar chart)
- Event ROI by Event (table with cost, pipeline, and ratio)
- Speed to Pipeline by Event (average days to opp creation)
How to Set Up Event Attribution in HubSpot
HubSpot handles event attribution differently from Salesforce. The core concepts are the same: campaigns, contact association, and influence tracking. But the setup, terminology, and reporting paths diverge enough that copying a Salesforce playbook into HubSpot won’t work. Here’s how to configure it correctly.
Campaign Structure
HubSpot doesn’t use a parent-child campaign hierarchy like Salesforce. Instead, you’ll use a combination of Marketing Campaigns and custom properties to organize your events.
- Create a Marketing Campaign for the event (e.g., “SaaStr Annual 2026”). Go to Marketing > Campaigns > Create Campaign. Set the start and end dates, assign a budget, and tag the campaign goal (e.g., “Generate Pipeline” or “Brand Awareness”). This campaign becomes the container for all event-related assets and contacts.
- Associate all event assets with the campaign. Landing pages, follow-up emails, form submissions, and any paid ads promoting the event should all be linked to this campaign. HubSpot tracks revenue influence through these asset associations, so missing one means missing attribution data.
- Use custom properties for event hierarchy. If you run multiple activities within one event (booth, VIP dinner, keynote), create a custom contact property like “SaaStr 2026 Activity” with dropdown values for each activity type. This gives you the segmentation that Salesforce handles through sub-campaigns.
Contact Tracking and Lifecycle Stages
HubSpot’s attribution relies on contact interactions with campaign-associated assets. For physical events, you need to create those touchpoints manually since there’s no digital trail.
Import event contacts and associate them with the campaign. After the event, import your badge scan CSV into HubSpot. During import, map contacts to the correct lifecycle stage and associate them with your event campaign. Use email as the primary deduplication key. HubSpot will match existing contacts automatically if the email address is the same.
Create a custom “Event Engagement” property. HubSpot doesn’t have Campaign Member statuses like Salesforce. Build this yourself with a dropdown contact property:
Update this property during or right after the event. Your reps can do this directly in the HubSpot mobile app, or you can bulk-update via import.
Log event interactions as Activities. For contacts who had substantive conversations, create a logged activity (Meeting or Note) on their contact record. Include details about what was discussed and any next steps. These logged activities feed into HubSpot’s attribution reports as touchpoints. Without them, the event interaction is invisible to the attribution model.
Attribution Reporting
HubSpot offers built-in attribution reporting in Marketing Hub Professional and Enterprise. You’ll find two report types under Reports > Attribution.
Contact Create Attribution: Shows which interactions led to a contact being created. If someone’s first interaction with your brand was the event (and you logged it), the event gets credit for creating that contact. This is the HubSpot equivalent of “event-sourced” leads.
Revenue Attribution (Deal Create and Revenue): Shows which interactions influenced deal creation and closed revenue. This is where event ROI lives. HubSpot’s revenue attribution connects the touchpoints on associated contacts to the deals they’re linked to.
Configure your attribution model:
- Go to Reports > Attribution Reports > Create Report
- Choose “Revenue Attribution” for pipeline and closed-won analysis
- Select your model: Linear, First Interaction, Last Interaction, U-Shaped, W-Shaped, or Full Path
- Filter by campaign to isolate your event’s contribution
For event marketing, W-Shaped or Full Path models work best. They give credit to first touch, lead creation, and deal creation, which captures the event’s role in starting relationships while recognizing the sales work that followed.
The attribution window matters here too. HubSpot’s default attribution lookback window varies by report type. For contact create attribution, HubSpot considers all interactions before the contact was created. For revenue attribution, it looks at interactions between the contact’s creation and the deal’s close date. If a contact existed in your CRM before the event, only their post-event interactions (like a logged meeting or form fill from a follow-up email) will count unless you manually log the event touchpoint with a date stamp.
Build Your Event Dashboard
Create a custom dashboard with these reports:
- Contacts Created by Event Campaign (contact create attribution, filtered by campaign)
- Pipeline Influenced by Event Campaign (revenue attribution, W-Shaped model, filtered by campaign)
- Deal Stage Funnel for Event Contacts (funnel report using your custom Event Engagement property)
- Event ROI Summary (custom report comparing campaign spend to attributed revenue)
HubSpot’s native attribution reports give you a solid starting point. But they hit limits when you need to connect event engagement depth (the difference between a badge scan and a 30-minute demo) to specific deal outcomes. The reports can tell you which campaign influenced a deal; they can’t tell you that the “Met with Rep” interaction at your booth was the moment the buyer got serious. That depth requires either custom reporting work or a tool that maps engagement-level data to revenue natively inside your CRM.
Five Mistakes That Kill Your Event Attribution Data
1. Not Creating CRM Campaigns Before the Event
If you don’t set up the Campaign before the event, you’ll be playing catch-up. Pre-loading target accounts as “Invited” members gives you a starting point. This lets you track conversion from “Invited” to “Attended” to “Met with Rep” to Opportunity. Without this baseline, you miss the top of the funnel.
2. Depending Entirely on Badge Scans
Badge scans only show that someone was near your booth—they don’t tell you what happened. Without engagement-depth data, a scan is just a name, not a qualified lead. Set up a workflow to capture whether a visitor had a conversation, watched a demo, or asked about pricing. The difference between a badge scan and a meeting note is the difference between noise and useful information.
3. Using Too Short an Attribution Window
A 14-day attribution window might work for a webinar. It doesn’t work for events. B2B deals take months. Set your Salesforce Campaign Influence window to at least 90 days. For enterprise sales cycles, 180 days is more appropriate. Run a backtest: pull your closed-won deals from the last year and check how many had an event touchpoint more than 30 days before the opportunity was created. That number will convince your team to extend the window.
4. Counting Leads Instead of Pipeline
Saying “We generated 300 leads” isn’t a business result. Your CFO cares about pipeline and revenue, not just leads. Report event-sourced pipeline value, event-influenced pipeline value, and cost per opportunity. If you can only track one thing, focus on event-sourced pipeline per dollar spent.
5. Ignoring Existing Contacts Who Re-Engaged
Not everyone who visits your booth is a new lead. Many are existing contacts or current customers. If someone who went quiet three months ago stops by and re-engages, that’s valuable too. But if your system only counts new leads, you’ll miss this. Track re-engagement by checking how many event contacts were already in your CRM before the event. “Reactivated” pipeline is just as important as “new” pipeline.
How Heeet Tracks Event Influence in Multi-Touch Attribution
The hardest part of event attribution isn’t capturing badge scans or setting up campaigns. It’s seeing the event’s influence three months later when an opportunity finally opens.
Most attribution setups lose the thread between the event and the deal. The event campaign sits in your CRM. The opportunity sits in your CRM. But the connection between them fades as weeks pass, new touchpoints pile up, and the original event interaction gets buried under dozens of other marketing activities.
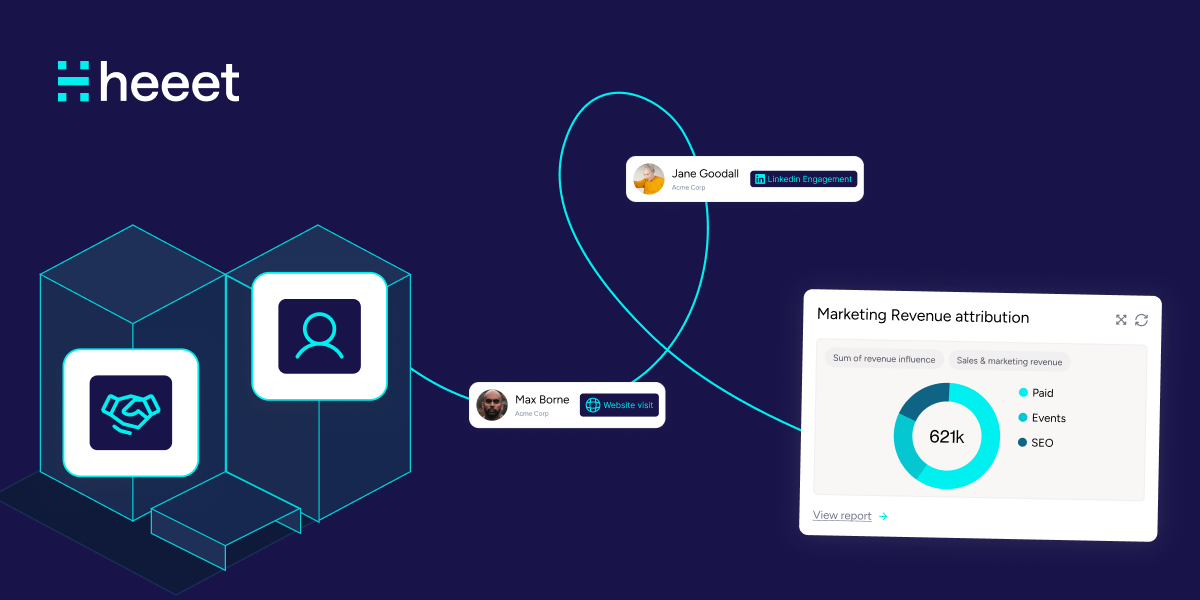
Heeet solves this by writing attribution data directly into your CRM records, in both Salesforce and HubSpot, as native objects. Every touchpoint in the buyer’s journey, including the event, gets recorded as a Heeet Touchpoint on the contact record. When that contact is later associated with an opportunity, Heeet automatically calculates how much credit each touchpoint deserves based on the attribution model you’ve chosen.
Here’s what that looks like in practice. Sarah visited your booth at SaaStr in March. Your rep scanned her badge, and she’s now a Campaign Member (Salesforce) or an associated contact (HubSpot) with a “Met with Rep” status. In April, she clicks on a LinkedIn ad and downloads a white paper. In May, an SDR books a call. In June, the deal opens.
Without Heeet, the March event touchpoint either gets no credit (last-touch model) or requires manual reporting to connect it to the June opportunity. With Heeet, the event sits in the Touchpoint timeline alongside every other interaction. When the opportunity opens, Heeet runs your chosen attribution model (linear, U-shaped, W-shaped, or custom) across all touchpoints and assigns weighted revenue credit to each one, including the event.
This works because Heeet doesn’t rely on short attribution windows. The touchpoint data persists on the contact record indefinitely. Whether the opportunity opens two weeks or six months after the event, the event interaction is still there, still weighted, still counted.
For marketing teams running multiple events per year, this changes the budget conversation. Instead of saying “we think SaaStr helped,” you can pull up a report showing $430,000 in pipeline where SaaStr was a contributing touchpoint, with a specific percentage of credit based on your model. You can compare that against your $150,000 investment and show a real return, not an estimate.
The data lives inside your CRM, on the deal record, on the contact timeline, in your existing reports. No external dashboards. No CSV exports. No spreadsheet joins. Just event data connected to revenue, visible to everyone on the team who needs it.
Other articles
.svg)
Ready to track prospects from lead to close with Heeet?
Heeet gives marketers and sales professionals at IT & Security firms turn geuss work intro informed decisions that drive revenue while meeting the same secruity technical standards you provide your clients.