Read time :
Content Marketing Analytics: The Complete Guide to measure and show content ROI in 2026
Content marketing analytics track audience interactions with your content, linking metrics like page views and engagement directly to business outcomes, such as revenue.


Most content teams report traffic and engagement, but leadership asks about ROI. Bridging this gap protects content budgets and realigns sales and marketing on the content that helps both teams reach their shared goals. This guide covers essential metrics, B2B attribution, and building reporting to prove content's revenue impact to leadership.
What is content marketing analytics?
Content marketing analytics systematically collect, measure, and analyze audience interactions, linking content efforts to business outcomes such as pipeline and revenue. The key aspect is the link to pipeline and revenue, that’s where you’re proving ROI, but it’s also the most difficult link to make.
Anyone working in content creation has run into the same wall analytical in the past. You conduct keyword and competitive research, create the content, distribute it across channels, and measure engagement. Great start, but engagement isn’t the end goal. You need to build a system that lays the foundation for ROI discussions.
For B2B executives, it’s the difference between “we published 50 blog posts” and “our content influenced $2.3 million in closed deals.” Consumption metrics reveal audience reach, engagement signals indicate the depth of interaction, and conversion data indicate which business actions follow. The true value for your leadership team lies in connecting these insights across the entire buyer journey.
As Romain Blanc, our Co-founder and a Salesforce ecosystem specialist with 20+ years in B2B data solutions, puts it: “The only way to accurately calculate the cost and value of content in B2B is to capture engagement throughout the buyer journey, which conventional analytics setups don’t credit.”
The disconnect exists because engagement data and revenue data are in separate systems. Google Analytics tracks sessions while your CRM tracks opportunities. Without a bridge, content teams aren’t using impactful metrics in leadership meetings. You need to start speaking the language of revenue.
Why content marketing analytics matters for revenue teams
It all boils down to showing content’s worth.
Content analytics reshape executive-level discussions. When marketers lead with proof that, for example, a specific whitepaper generated 47 opportunities valued at $1.8 million, and not the number of downloads, conversations shift from budget scrutiny to scaling high-impact initiatives.
This is the data that makes every content marketer’s life easier when you have to:
- Justify Budget: Use revenue-centric data to replace broad engagement metrics in leadership reviews. When attribution integrates into your CRM, finance leaders can see the actual pipeline impact of each content investment and content type.
- Optimize Strategy: Focus investments on content formats and topics that drive pipeline; discontinue underperformers. For example, Heeet prioritized Salesforce attribution content after seeing pipeline growth. This reinforces a revenue backed content flywheel strategy that ensures the your focusing on increasing the resonance of content that you know works.
- Imoprove Sales Alignment: Ensure sales teams can quickly see which content prospects consumed before demos. Repurpose that content in sales enablement and nurture campaigns. Then use this activity data to personalize conversations based on actual behaviour rather than guesswork.
How content analytics differs from web analytics
They both matter; one gives you insight into how to improve the other. Web analytics and content analytics overlap but serve different purposes. Web analytics tells you that 10,000 people visited your site last month. Content analytics shows that your comparison guide influenced 23 opportunities, and your product overview page contributed $450,000 in closed revenue.
Both matter. But to prove content ROI, you need a content-specific lens.
What differentiates content analytics is its requirement to connect content engagement data directly to your CRM, where revenue metrics reside. In practical conversations with B2B companies, the inability to link traffic and engagement metrics to pipeline or revenue is still a persistent barrier. A CRM-native attribution solution bridges this gap, transforming analytics into actionable revenue intelligence for business growth.
Essential content marketing metrics to track
B2B metrics should be segmented and aligned with company targets to expose the most relevant facets of content performance. Prioritize analytics and reporting formats that address executive concerns and deliver strategic business insights.
Consumption metrics
Consumption metrics measure how visible your content is. Pageviews represent the total number of times a page is loaded. Unique visitors reflect the count of individual users who access the page. Scroll depth indicates how far readers progress on a single page. These metrics display whether content is noticed, but don’t measure business impact.
Current market dynamics, such as AI’s impact on B2B buyer research, may lead to a decline in traditional traffic metrics. Many buyers source answers from AI tools rather than visiting your site, diminishing the value of raw traffic alone. Leadership is best served by measuring pipeline and revenue impact, not just site visitors, to ensure the content strategy aligns with evolving buyer behaviour.
Engagement metrics
Engagement signals deeper interest. Social shares suggest the content resonated enough to recommend. Comments indicate active thinking. Video completion rates indicate whether your tutorial held viewers' attention or lost them at the two-minute mark. High engagement often correlates with quality, though the connection to revenue isn’t automatic.
Content engagement tracking becomes a powerful sales enablement tool when connected to your CRM. As Heeet demonstrates in client demos, tracking which specific pages a prospect visited during their buyer journey helps sales teams identify patterns. For example, if a prospect hasn’t visited the pricing page, that can be a red flag regarding engagement level. If they’ve read four blog posts and downloaded a case study, sales knows they’re seriously evaluating.
Lead generation metrics
Lead generation metrics reveal when content drives potential buyers to take action. Form fills are counted when a user completes and submits a form on a specific blog post or landing page. Newsletter signups are tracked when users provide their email address via a designated signup form. Gated content downloads are counted when users fill out required details to access resources like ebooks or whitepapers. These metrics show the transition from simple engagement to actionable steps.
But heavy gating creates friction. When every asset requires a form, you lose anonymous engagement data and frustrate buyers who aren’t ready to identify themselves. Consider ungating more content and tracking influence differently. A prospect who reads five ungated blog posts signals intent even without filling out a form. CRM-native attribution platforms can track this ungated engagement and connect it to the pipeline when the prospect eventually converts.
Sales and revenue metrics
Sales and revenue metrics matter most to leadership, make sure your sharing these three key confidence drivers with them:
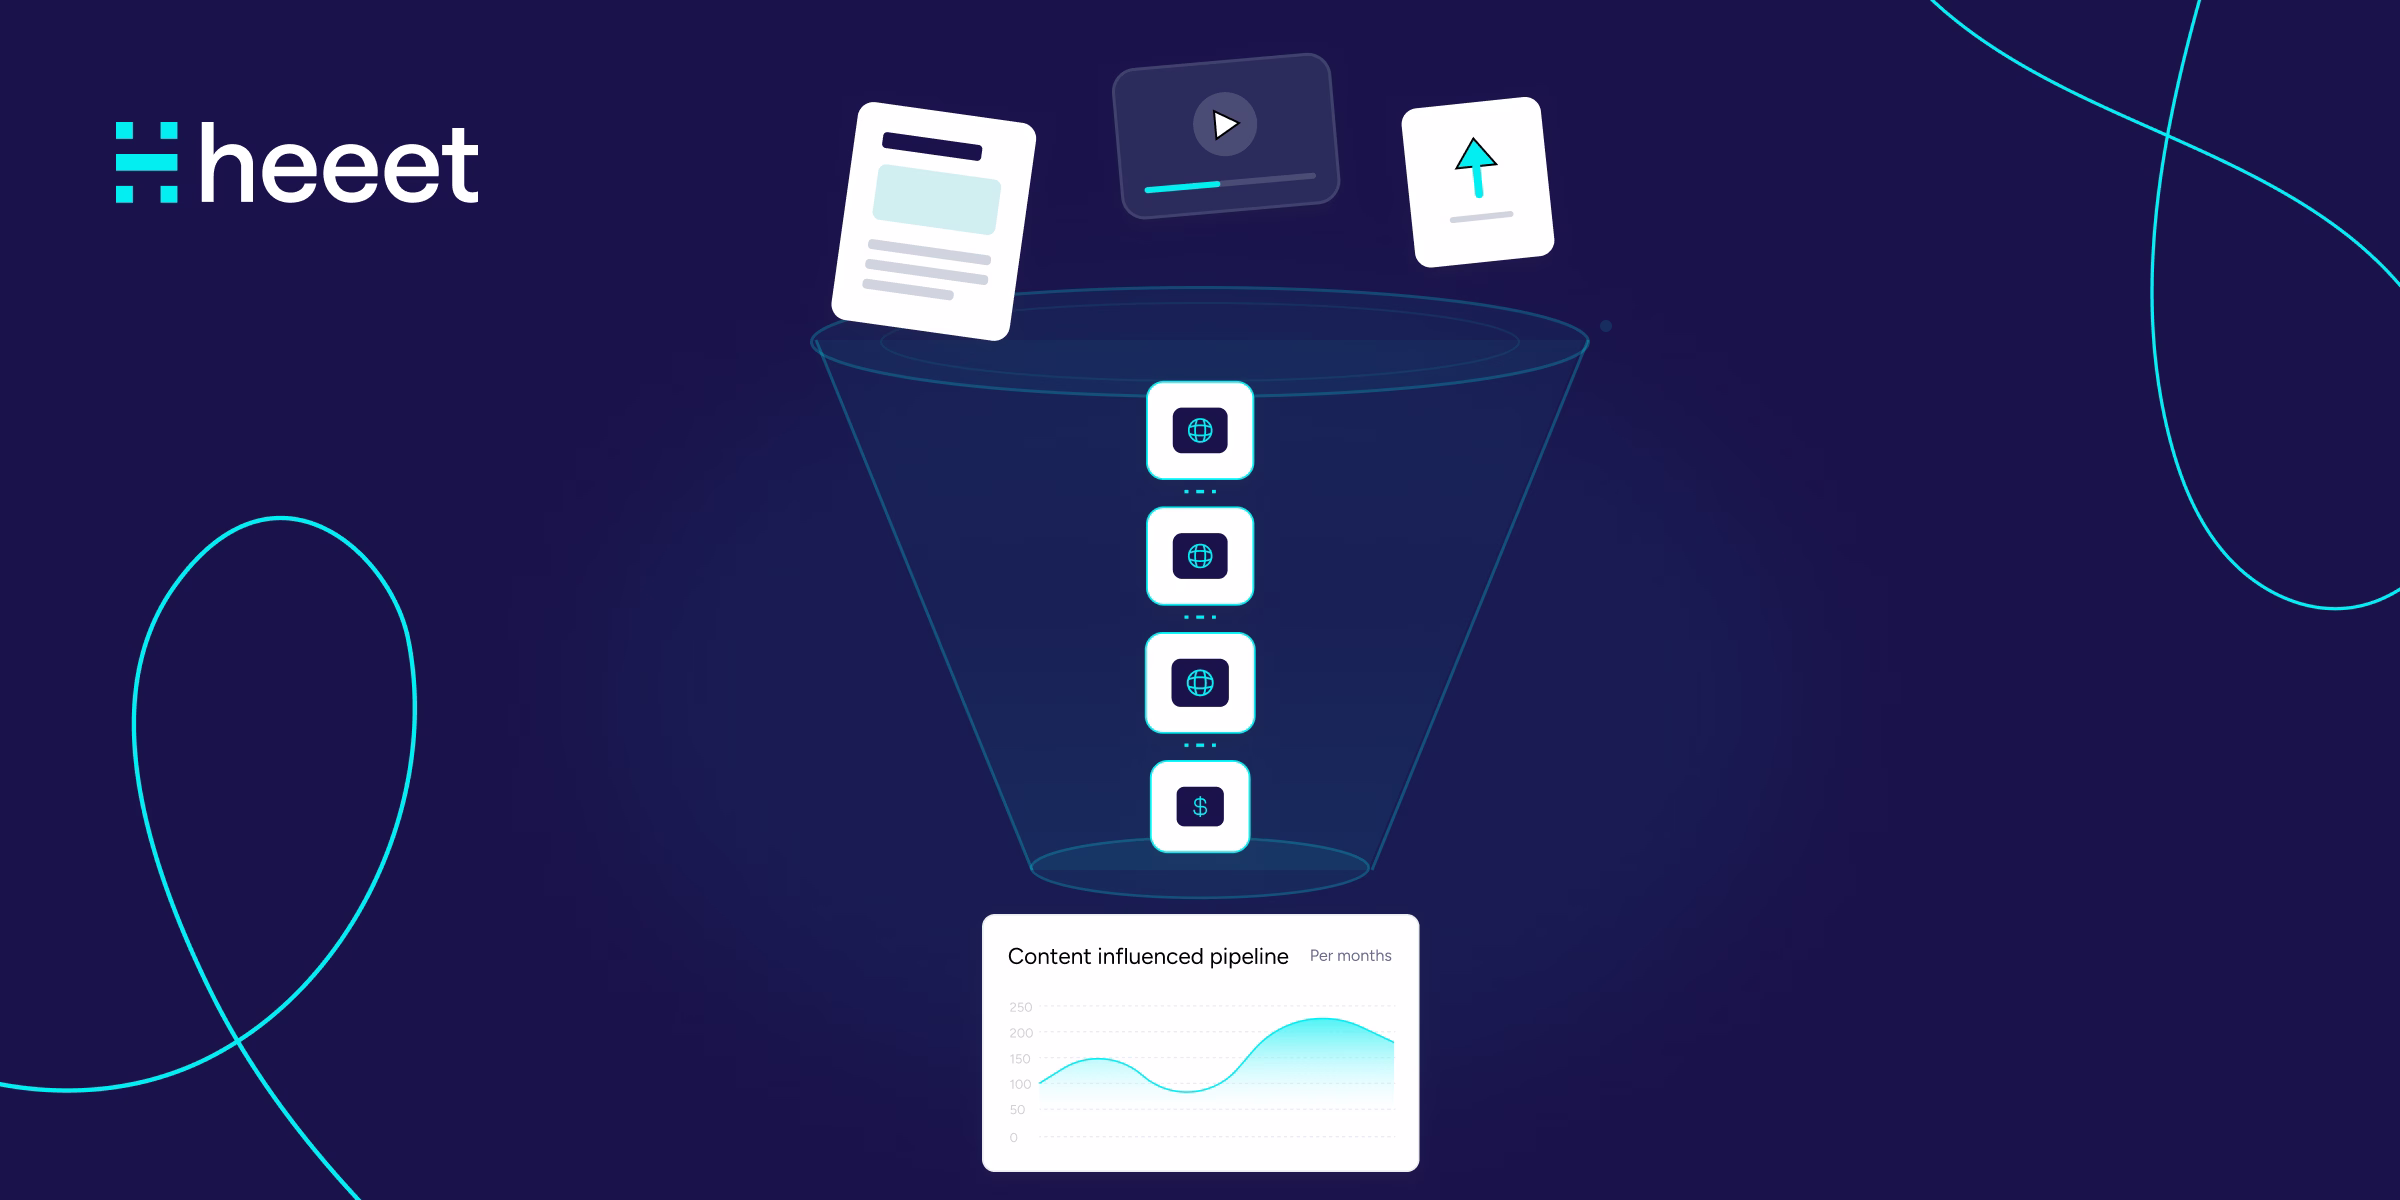
- Content-influenced pipeline is the total value of sales opportunities where content influenced a buyer at any stage. For example, if your comparison guide was accessed by decision-makers on opportunities worth $1.2 million last quarter, that amount is considered influenced pipeline, providing a clear metric to share with executives.
- Content-attributed revenue refers to total revenue from closed deals where specific content engagements occurred earlier in the customer journey. It’s calculated by matching content touchpoints to completed sales in your CRM. This makes the link between content and revenue explicit.
- Deal velocity impact measures how content engagement affects the speed of a sale. Compare the average sales cycle duration for opportunities in which prospects engaged with content to those in which they did not. If engaged, deals close faster, it shows content is accelerating revenue.
Cost and ROI metrics
Cost and ROI metrics show financial effectiveness. Cost per piece, cost per lead, and content ROI compare the creation costs to the revenue generated.
Compare investments across different content types against the generated pipeline. Blog posts might cost less to produce than webinars but generate comparable pipeline influence. This data directly informs resource allocation and helps you build what Heeet calls a “revenue-driven content flywheel,” where each winning piece of content fuels the next.
Content attribution models for B2B marketing
Attribution determines how credit for conversions gets distributed across touchpoints. B2B buying journeys involve multiple interactions over months. Choosing the right model matters.
Attribution model selection comes down to one question: what are you trying to optimize? Use models in combination, not in isolation. First-touch reveals what creates awareness. Last-touch reveals what closes deals. Multi-touch shows the full picture.
First-touch attribution
All credit goes to the first content interaction. Simple to implement, but ignores everything that happened after initial awareness. That nurture sequence? The case study before the demo? Invisible.
Standard attribution tools often use 30 or 90-day windows. Enterprise B2B deals rarely close that fast. A prospect discovers your brand through organic search in January, becomes an MQL in April, gets qualified in June, and the deal closes in October. A 90-day window captures none of the early influence on content. Without the right tools to document the journey, the first-touch blog posts are entirely absent from the data when that lead finally becomes a paying customer.
Last-touch attribution
All credit goes to the final touchpoint before conversion. This model overlooks the content that builds awareness and consideration. The blog post that started the journey six months ago gets zero credit.
Linear attribution
Equal credit is distributed across all touchpoints. Fair to every piece of content, but may overweight low-impact interactions. A casual blog skim gets the same credit as an in-depth product comparison.
W-shaped and U-shaped attribution
Weighted models emphasize key moments. W-shaped typically allocates 30% to first touch, 30% to lead creation, 30% to opportunity creation, with 10% spread across middle interactions. For B2B content measurement, weighted models often perform best because they account for distinct journey phases.
W-shaped attribution works particularly well for content analytics because it credits the content that created awareness, converted a visitor into a lead, and influenced opportunity creation. This maps directly to the content funnel stages that most teams already think in terms of. CRM-native platforms like Heeet let you configure these weightings directly inside Salesforce or HubSpot and adjust them as your understanding matures.
Data-driven attribution
Machine learning determines credit distribution based on actual conversion patterns. Requires significant data volume to produce accurate models. Promising but not practical for smaller teams.
How to measure content performance data across the buyer journey
Different content serves different purposes. Measuring a top-of-funnel blog post the same way you measure a bottom-of-funnel case study misses the point entirely.
Awareness stage content metrics
Focus on reach and discovery. Blog traffic, organic search visibility, social impressions. Awareness content introduces your brand to prospects. Don’t expect direct conversions from awareness content.
Problem-focused content outperforms feature-focused content at this stage. For instance, writing content around “How to prove marketing ROI to your CFO” attracts more qualified visitors than “Marketing attribution software features.” The difference is quantifiable: problem-focused keywords not only drive better engagement but often result in higher-value pipeline actions.
Consideration stage content metrics
Track deeper engagement. Whitepaper downloads, webinar registrations, comparison page visits, and return visits. Prospects in consideration mode want substance. Multiple content touches during consideration often signal serious buying intent.
This is also where your sales and demo calls become a goldmine of content intelligence. What are the recurring questions prospects ask? What misconceptions can you dispel before the call that might otherwise become objections? Heeet’s analysis of 20+ demo transcripts revealed that the #1 question prospects ask is: “How does attribution work natively inside my CRM?” That insight directly shapes what consideration-stage content to create. A recurring sales objection, such as “We can’t prove ROI to finance,” becomes a detailed ROI calculation guide that both educates leads and qualifies them.
Decision stage content metrics
Measure conversion influence. Demo requests influenced by content, case study engagement before closed deals, and pricing page attribution. Decision-stage content closes confidence gaps and connects most directly to revenue.
Visualizing content’s impact throughout the buyer journey
Once you understand the role content plays at each phase of the funnel, you need to see exactly which pieces are pushing people to a final sale. With content analytics linked to contact records, you can see what pages are accelerating pipeline velocity and which stakeholders in buying committees are engaging with specific content. This gives you not only the intent data to send over to sales for key accounts but the priority list for content to refresh, think about:
- Content drift: are you using the correct messaging on these key pages?
- Updating Case Studies: are qualified leads reading a case study with a client that has since seen improved success and uses more of your product? It’s time to put the the full-breadth of your collaboration in the spotlight.
How to connect content to pipeline and revenue
Tracking which content assets influence deals requires technical infrastructure. The payoff is transforming vague content metrics into concrete proof of revenue.
- Implement cookieless JavaScript tracking across all pages to capture content engagement without relying on third-party cookies, which browsers increasingly block. UTM parameter capture and form field integration pass source data through to your CRM.
- Connect to CRM: Push content engagement data into lead and opportunity records where revenue lives. This is where CRM-native solutions provide a distinct advantage. Data sent directly to your Salesforce or HubSpot instance means no external servers storing your data, no export/import workflows, and no reconciling conflicting numbers between systems.
- Track post-MQL content influence: One of the biggest blind spots in content analytics is what happens after the MQL handoff. Marketing teams consistently describe a “black box” once sales takes over. But prospects continue engaging with content throughout the sales cycle: reading blog posts, viewing pricing pages, and downloading case studies. Capturing these post-acquisition touchpoints is often the moment when content analytics shifts from “interesting” to “essential.”
- Set attribution windows: Define how far back to credit content (typically 90-180 days for B2B). Longer enterprise sales cycles often require longer windows.
- Build reports: Create dashboards showing the pipeline influenced by the content asset. CRM-native platforms include pre-built dashboards and enable custom reporting during onboarding.
CRM-native solutions eliminate data silos by keeping everything in Salesforce or HubSpot. No exporting to external platforms, no reconciling conflicting numbers. When sales and marketing see the same attribution data inside the CRM, finger-pointing decreases and collaboration increases.
Lead quality analytics for content marketing
Lead volume means nothing if leads don’t convert. Content that attracts unqualified traffic wastes resources and frustrates sales.
Quality analytics examines whether content attracts your ideal customer profile. Do content-sourced leads score higher? Which content produces leads that become opportunities? Does content engagement correlate with faster sales cycles?
Segment analysis by ICP, persona, and deal stage reveals patterns. Maybe your technical deep dives attract qualified engineers, while your overview content attracts students researching papers.
CRM-native content tracking makes this analysis straightforward. Tools like Heeet show you exactly how many leads engage with each piece of content on your website, how many of those leads convert, and how much revenue each piece of content ultimately drives, all broken down by persona. This level of granularity tells you which content attracts your ICP versus which content generates noise.
Top content marketing analytics tools and platforms
Tool selection depends on your tech stack, budget, and attribution requirements. Each category has tradeoffs.
Google Analytics 4
Free and powerful for traffic and engagement. Limited ability to connect to revenue without significant integration work. Good starting point, but insufficient to prove content ROI. GA4 tells you sessions happened. It doesn’t tell you which sessions became pipeline. While it’s not the complete solution, it’s necessary to have in place so you can pull data from GA4 into tools like Heeet and other customer journey tracking tools to make the revenue link from content to commas.
HubSpot content analytics
Built-in reporting for HubSpot users. Full revenue attribution requires Marketing Hub Enterprise at $3,600+ monthly. It’s an option for enterprise teams already in the HubSpot ecosystem, but not ideal for teams looking to test a new tool before committing to a +30k solution.
Semrush, Ahrefs and SEO tools
These are the tried-and-tested complementary tools you need to create your content, which also offer great engagement and traffic analytics. Strong for organic content performance, keyword tracking, and competitive analysis, but they’re not designed for revenue attribution.
Heeet’s CRM-native analytics platform
Solutions that embed analytics directly inside Salesforce or HubSpot keep data in one place and enable revenue attribution without exporting to external tools. CRM-native platforms eliminate the “which number is right?” debates that plague teams using multiple disconnected platforms.
Heeet installs as a native Salesforce or HubSpot package with cookieless JavaScript tracking. Implementation takes hours, not months. It tracks multi-touch attribution across all marketing channels (paid ads, organic content, events, webinars), connects every touchpoint to pipeline and closed revenue, and delivers pre-built dashboards showing ROI, CAC, and CPL by channel and content asset.
Because the data lives natively inside the CRM, there’s no security concern about data leaving your environment and no conflicting numbers between platforms. It also places the content ROI metrics front and center for sales, in the CRM, where they spend most of their time outside of calls and their inbox.
With content-level tracking implemented natively in your CRM: you see which specific blog posts, landing pages, and resources each lead engaged with throughout their journey, and that engagement data flows directly into the opportunity record. Sales teams use this to personalize outreach. Marketing teams use it to identify the most converting content. Leadership uses it to justify investment with numbers they already trust. That’s virtuous cycle that evert content marketer would love to find themselves in.
How to build a content marketing performance analytics dashboard
Half the battle is putting the numbers in front of the eyes that matter. While no one likes setting up a dashboard, it turns raw data into actionable insights you can leverage and builds company-wide confidence in your efforts. FYI, Heeet comes pre-loaded with the dashboards you need to shine the light on revenue-related metrics rather than vanity numbers. If yo’’re working on putting this together before implementing a tool that puts this in place, here are the steps to follow:
1. Define your key performance indicators
Start with business outcomes and work backward. Pipeline influenced, revenue attributed, cost per opportunity by content. KPIs connect to what leadership cares about.
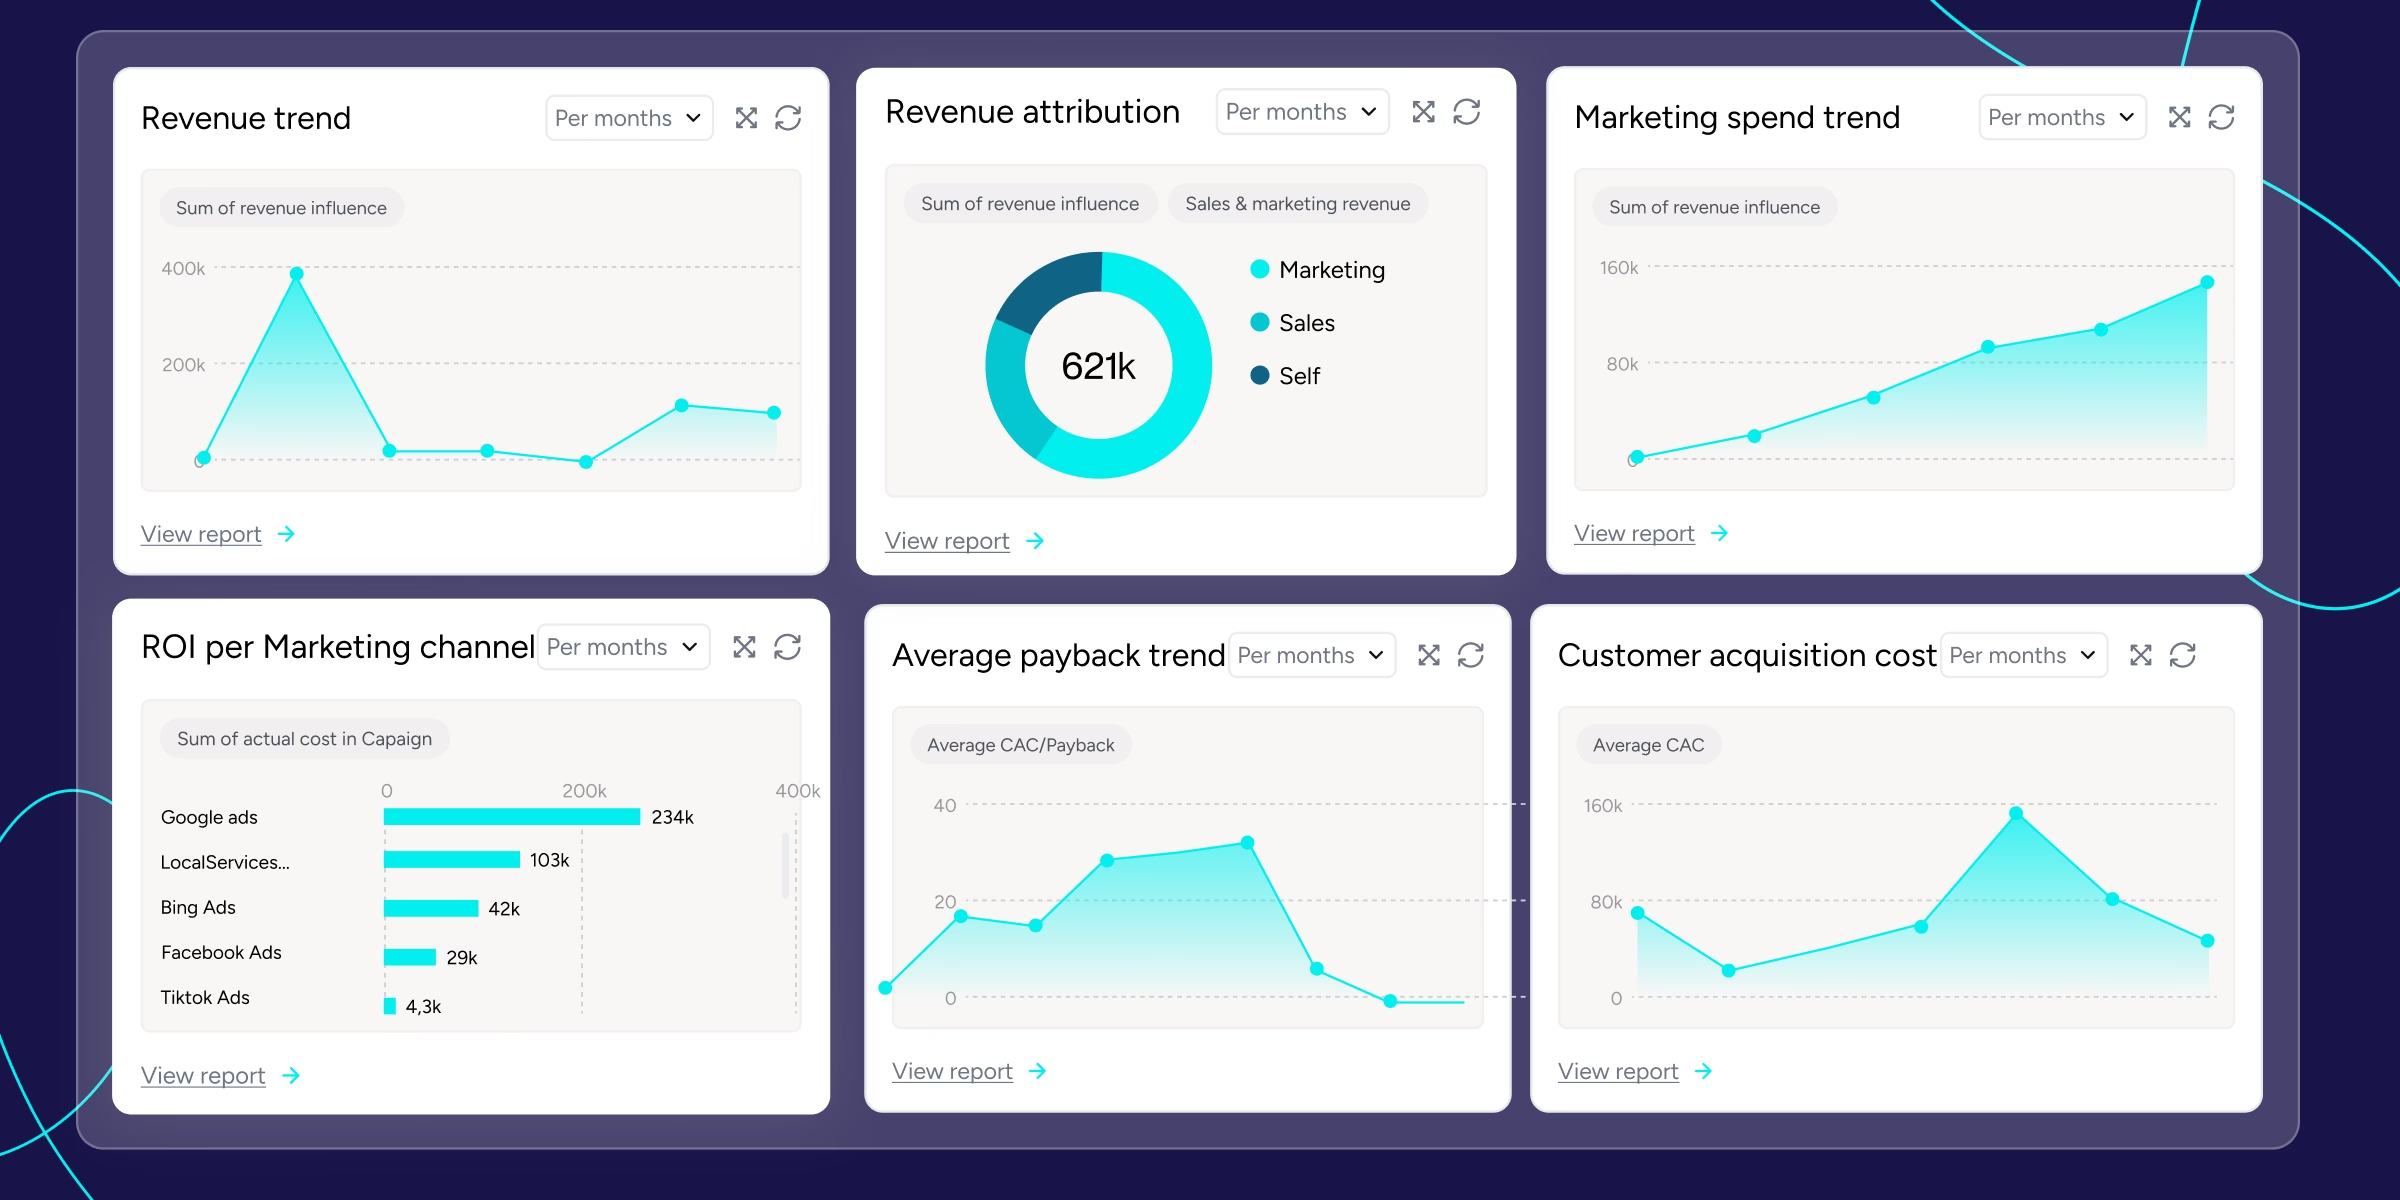
The most impactful dashboard for executive alignment centralizes revenue, marketing spend, acquisition cost, and payback period in a single view. You should be able to tell your CFO exactly how much you spent on every channel and content type, how much each generated, and whether they’re profitable.
2. Connect your data sources
Integrate website analytics, marketing automation, CRM, and ad platforms into a unified view. Disconnected data creates conflicting reports and erodes trust.
CRM-native attribution platforms dramatically simplify this step. Instead of building complex data pipelines between separate systems, the attribution data lives alongside the revenue data. Paid platform data syncs automatically (Google Ads, LinkedIn, Meta), content engagement flows in from your website, and event/webinar attendance connects through campaign membership. Everything converges in one place.
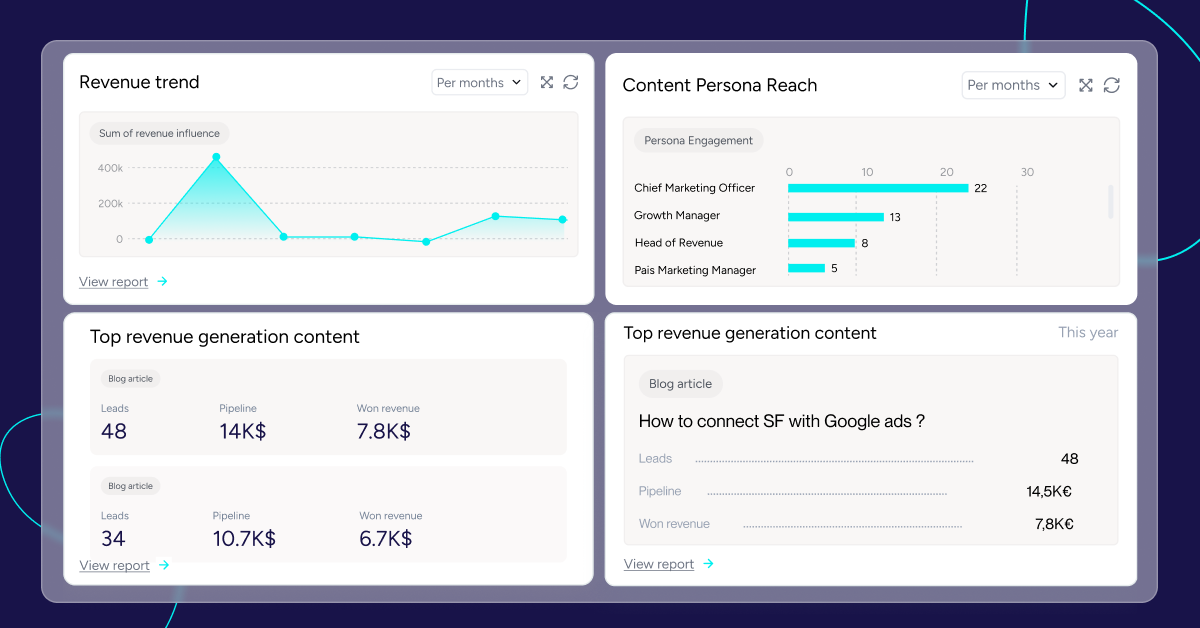
3. Create revenue-focused visualizations
Build charts that show content contributions to business outcomes. Pipeline by content asset. Revenue by content type. Conversion rates by funnel stage.
Sankey diagrams can show exactly which channels and content pieces your converted leads engaged with from first touch to closed deal, revealing the most successful content paths and where prospects drop off.
4. Automate report scheduling
Set up recurring reports for stakeholders. Monthly for trends, quarterly for strategic reviews. Automation ensures consistent visibility without manual effort. Go a step further and send the report through Slack or Teams. There’s nothing better than showing everyone you’re being proactive. It’s time to let the numbers not only speak for themselves but also present themselves in a timely manner.
Content marketing reporting best practices
Presenting findings effectively determines whether insights drive action. You need to create a report that starts with the full ROI outlook, followed by the accompanying metrics that allow everyone to drill down further.
Speak in revenue language.
Frame reports around pipeline and revenue, not clicks and impressions. “Our blog influenced $1.8 million in pipeline” resonates more than “we got 50,000 pageviews.” CFOs don’t care about engagement rates. They care about return on investment.
As Heeet’s team consistently sees in client engagements, the moment marketing can speak the same revenue language as sales and finance, budget conversations transform from “why are we spending this?” to “how do we scale what’s working?”
Segment reports by funnel stage
This is where you start diving deeper by showing how each content type performs at each stage. Awareness content generates reach. Consideration content drives engagement. Decision content influences conversions. Comparing them directly misses the point of each content type.
Include content-level attribution data.
Go beyond channel-level reporting. Which specific blog posts influenced deals? Which ebooks generated the most pipeline? Asset-level data enables precise optimization.
This is where multi-touch attribution reveals hidden contributors. A blog post that never generated a form fill might have touched 30 opportunities as a mid-journey content piece. Single-touch models would give it zero credit. Multi-touch models reveal their true influence on the pipeline.
Blend quantitative data with qualitative insights.
The best content analytics programs combine CRM tracking data with self-reported attribution (“How did you first hear about us?”) and insights from sales conversations. Up to 70% of the B2B buyer journey now happens in the “dark funnel”: private Slack messages, podcast mentions, WhatsApp forwards, and real-life conversations. Your tracking platform captures the digital journey. Self-reported attribution captures what planted the seed. Sales conversations reveal why the story played out the way it did. Combining all three gives you the complete picture.
Most useful content analytics reports for marketers
Here are some concrete examples of reports we use at Heeet that will help you build your own analytics practice.
Content Influence Report
Shows which content pieces touched leads before they became opportunities. Reveals hidden contributors that single-touch models miss entirely.
Pipeline by content asset report
Ranks individual content pieces by pipeline influence. Identifies top performers worth replicating and underperformers worth retiring or updating. This is the report that powers the content flywheel: find what’s generating revenue, double down on it, and recycle winning content across the channels your audience lives in.
Content ROI report
Compares content creation cost against attributed revenue. Proves return on content investment in terms that finance teams understand. When this data comes from your CRM, finance trusts the numbers because that’s where deals live.
Journey path analysis report
Visualizes common content sequences that drive conversions. Reveals optimal content paths and identifies where prospects drop off. CRM-native tools can surface journey patterns without complex data engineering.
Content velocity report
Measures whether content consumption accelerates or decelerates deal cycles. Do prospects who engage with more content close faster? Which content types appear in the fastest-closing deals? This reveals whether your content is actually reducing sales friction or just creating noise.
How to choose the right content marketing analytics tool
Vendor evaluation involves several criteria beyond feature lists:
- Native CRM integration: Does the tool live within your existing CRM, or does it require data export? Solutions that keep data inside Salesforce or HubSpot eliminate security concerns and ensure sales and marketing see the same numbers. Heeet, for instance, passed Salesforce’s security review and is available on the AppExchange, meaning all data stays within your CRM environment.
- Attribution model options: Can you choose models that match your sales cycle? Look for platforms that let you configure weightings (first-click, intermediary, last-click, post-acquisition) directly in your CRM.
- Content-level tracking: Does the platform track engagement with individual content assets and connect that data to the pipeline? This is the feature that separates content analytics from general marketing attribution.
- Data privacy and Cookieless tracking: Where does your data get stored? Is tracking cookieless? Cookie deprecation and consent rules make a growing share of journeys untrackable with traditional methods. Cookieless, first-party data approaches ensure you retain visibility regardless of browser settings.
- Account-level attribution: Enterprise B2B deals involve multiple contacts within an account, each doing independent research. The platform should roll up touchpoints from all contacts to the opportunity level, rather than just tracking individual journeys. This was consistently the strongest positive reaction in Heeet’s enterprise demos.
- Implementation time: Days or months? CRM-native platforms can typically go live in hours with pre-built dashboards and minimal technical lift.
- Reporting flexibility: Can you build custom reports? Pre-built dashboards get you started; custom reporting lets you answer the specific questions your leadership asks.
Stop guessing and prove content drives revenue.
Content marketing analytics transforms content from a cost center into a measurable revenue driver. The shift from “we published content” to “our content influenced millions in pipeline” changes how leadership views content investment.
The content game in 2026 isn’t being measured by output; AI has given everyone the means to post garbage at scale. You need to measure how the high-quality content you’re producing through contact-level and company-level interactions is influencing pipeline and revenue. Teams that have it figured out are building content flywheels so each winning piece of content fuels the next. They’re connecting engagement data to CRM opportunities. And they’re using that data to have fundamentally different budget conversations.
For teams using Salesforce or HubSpot, CRM-native analytics provides content attribution without data exports or complex implementation. All touchpoints, all attribution, all reporting lives where revenue data already exists.
Book a demo to see how CRM-native content attribution works in practice.
Other articles
.svg)
Ready to track prospects from lead to close with Heeet?
Heeet gives marketers and sales professionals at IT & Security firms turn geuss work intro informed decisions that drive revenue while meeting the same secruity technical standards you provide your clients.