

Read time :
B2B Marketing Attribution: A Practitioner’s Guide for Salesforce and HubSpot Teams
B2B channels continue to grow, dark social’s impact is amplifying, paid ads for B2B are moving into TikTok and beyond, and events are becoming more important as AI commodifies content creation. Those are just a few of the touchpoints that B2B teams need to trace to understand exactly what is driving pipeline and revenue.



B2B attribution accounts for the growing number of channels and stakeholders who influence purchase decisions by capturing interactions along the extended buyer journey and attributing credit to each interaction. With this data centralized and used to map out the path from first click to closed-won, GTM teams of all sizes can see what leads to success and build on the winning formula.
I built my first B2B marketing attribution model in 2016, on a whiteboard in a Paris co-working space, for a SaaS team that wanted to know which of their three demand-gen channels was producing pipeline. The whiteboard was correct. The implementation took eight months, broke every time a Salesforce admin renamed a field, and was replaced by a spreadsheet within a year.
Ten years and a few thousand demo conversations later, the spreadsheet remains the most relied-on tool for for B2B teams, and the dominant production attribution model is still last-touch.
I’m Romain Blanc, co-founder of Heeet. This is the guide I wish I’d had when I started building attribution for B2B teams.
It covers what B2B marketing attribution looks like in 2026, how various models behave when sales cycles run for a year or more, what changes when attribution lives inside Salesforce or HubSpot rather than a separate dashboard, and the places I see teams get stuck most often. Most of what’s below is what we’ve learned building the platform that Ringover, Red & Yellow, ABTasty, Mooncard, VIXIO, Culligan, Xendit, and a couple of dozen other B2B teams now run their attribution on.
TL;DR: B2B marketing attribution in 2026
If you’re after a quick review before you commit to the full guide, here’s the 90-second version.
- What is B2B attribution in one sentence? B2B marketing attribution is the practice of crediting every touch that influenced a closed-won deal. This is best done inside the CRM where the forecast already lives. Outside the CRM, attribution stays disconnected from your org.
- The B2B buyer has changed and the journey is long and winding. Buying committees are growing and using AI as their research tool of choice. Prolonged sales cycles fall between 10 and 12 months. You’ll need a system that can look beyond a 90-day attribution window to track the journey.
- Last-touch is still the model most B2B teams use. 90% of our prospects and clients come to demo or an initial setup with a last-touch model in Salesforce or HubSpot, which can’t pinpoint the revenue impact of every channel.
- Picking a model that covers the pre- and post-lead acquisition phases. The U or W-shaped models provide good initial coverage as default models. Graduate to data-driven once you have 200 to 300 closed-won deals a year with a consistent journey that starts to take shape.
- The 2026 stack is layered, not chosen. Multi-touch attribution for overall marketing and sales performance. Possibly first-touch to measure the efficacy of new paid channels. Self-attribution and customer interviews to confirm your findings and account for channels you can’t track. Teams running one of these options are common. Teams running all three on the same CRM record are pulling away.
- Cookieless and first-party data aren’t optional. Third-party cookies are no longer supported in several browsers, including Safari and Firefox. GCLIDs get stripped by consent mode. The fix for this new tracking gap is first-party tracking, server-side capture, and a CRM-native data foundation.
- Salesforce and HubSpot offer stopgap solutions. Salesforce includes Campaign Influence as the standard attribution solution, but not touchpoint capture across channels, or the ability to send revenue feedback from offline conversions to ad platforms to optimize buyer journeys. While HubSpot does offer Marketing Attribution Reports, they’re gated behind the Enterprise tier and lack granularity even at the high price point. HubSpot, on its own, still needs help with offline channels, account-level rollup, and sending revenue feedback to ad platforms. A packaged CRM-native layer fills the attribution void in both CRMs.
If any of that is news, the rest of the article is worth your time.
What is B2B marketing attribution?
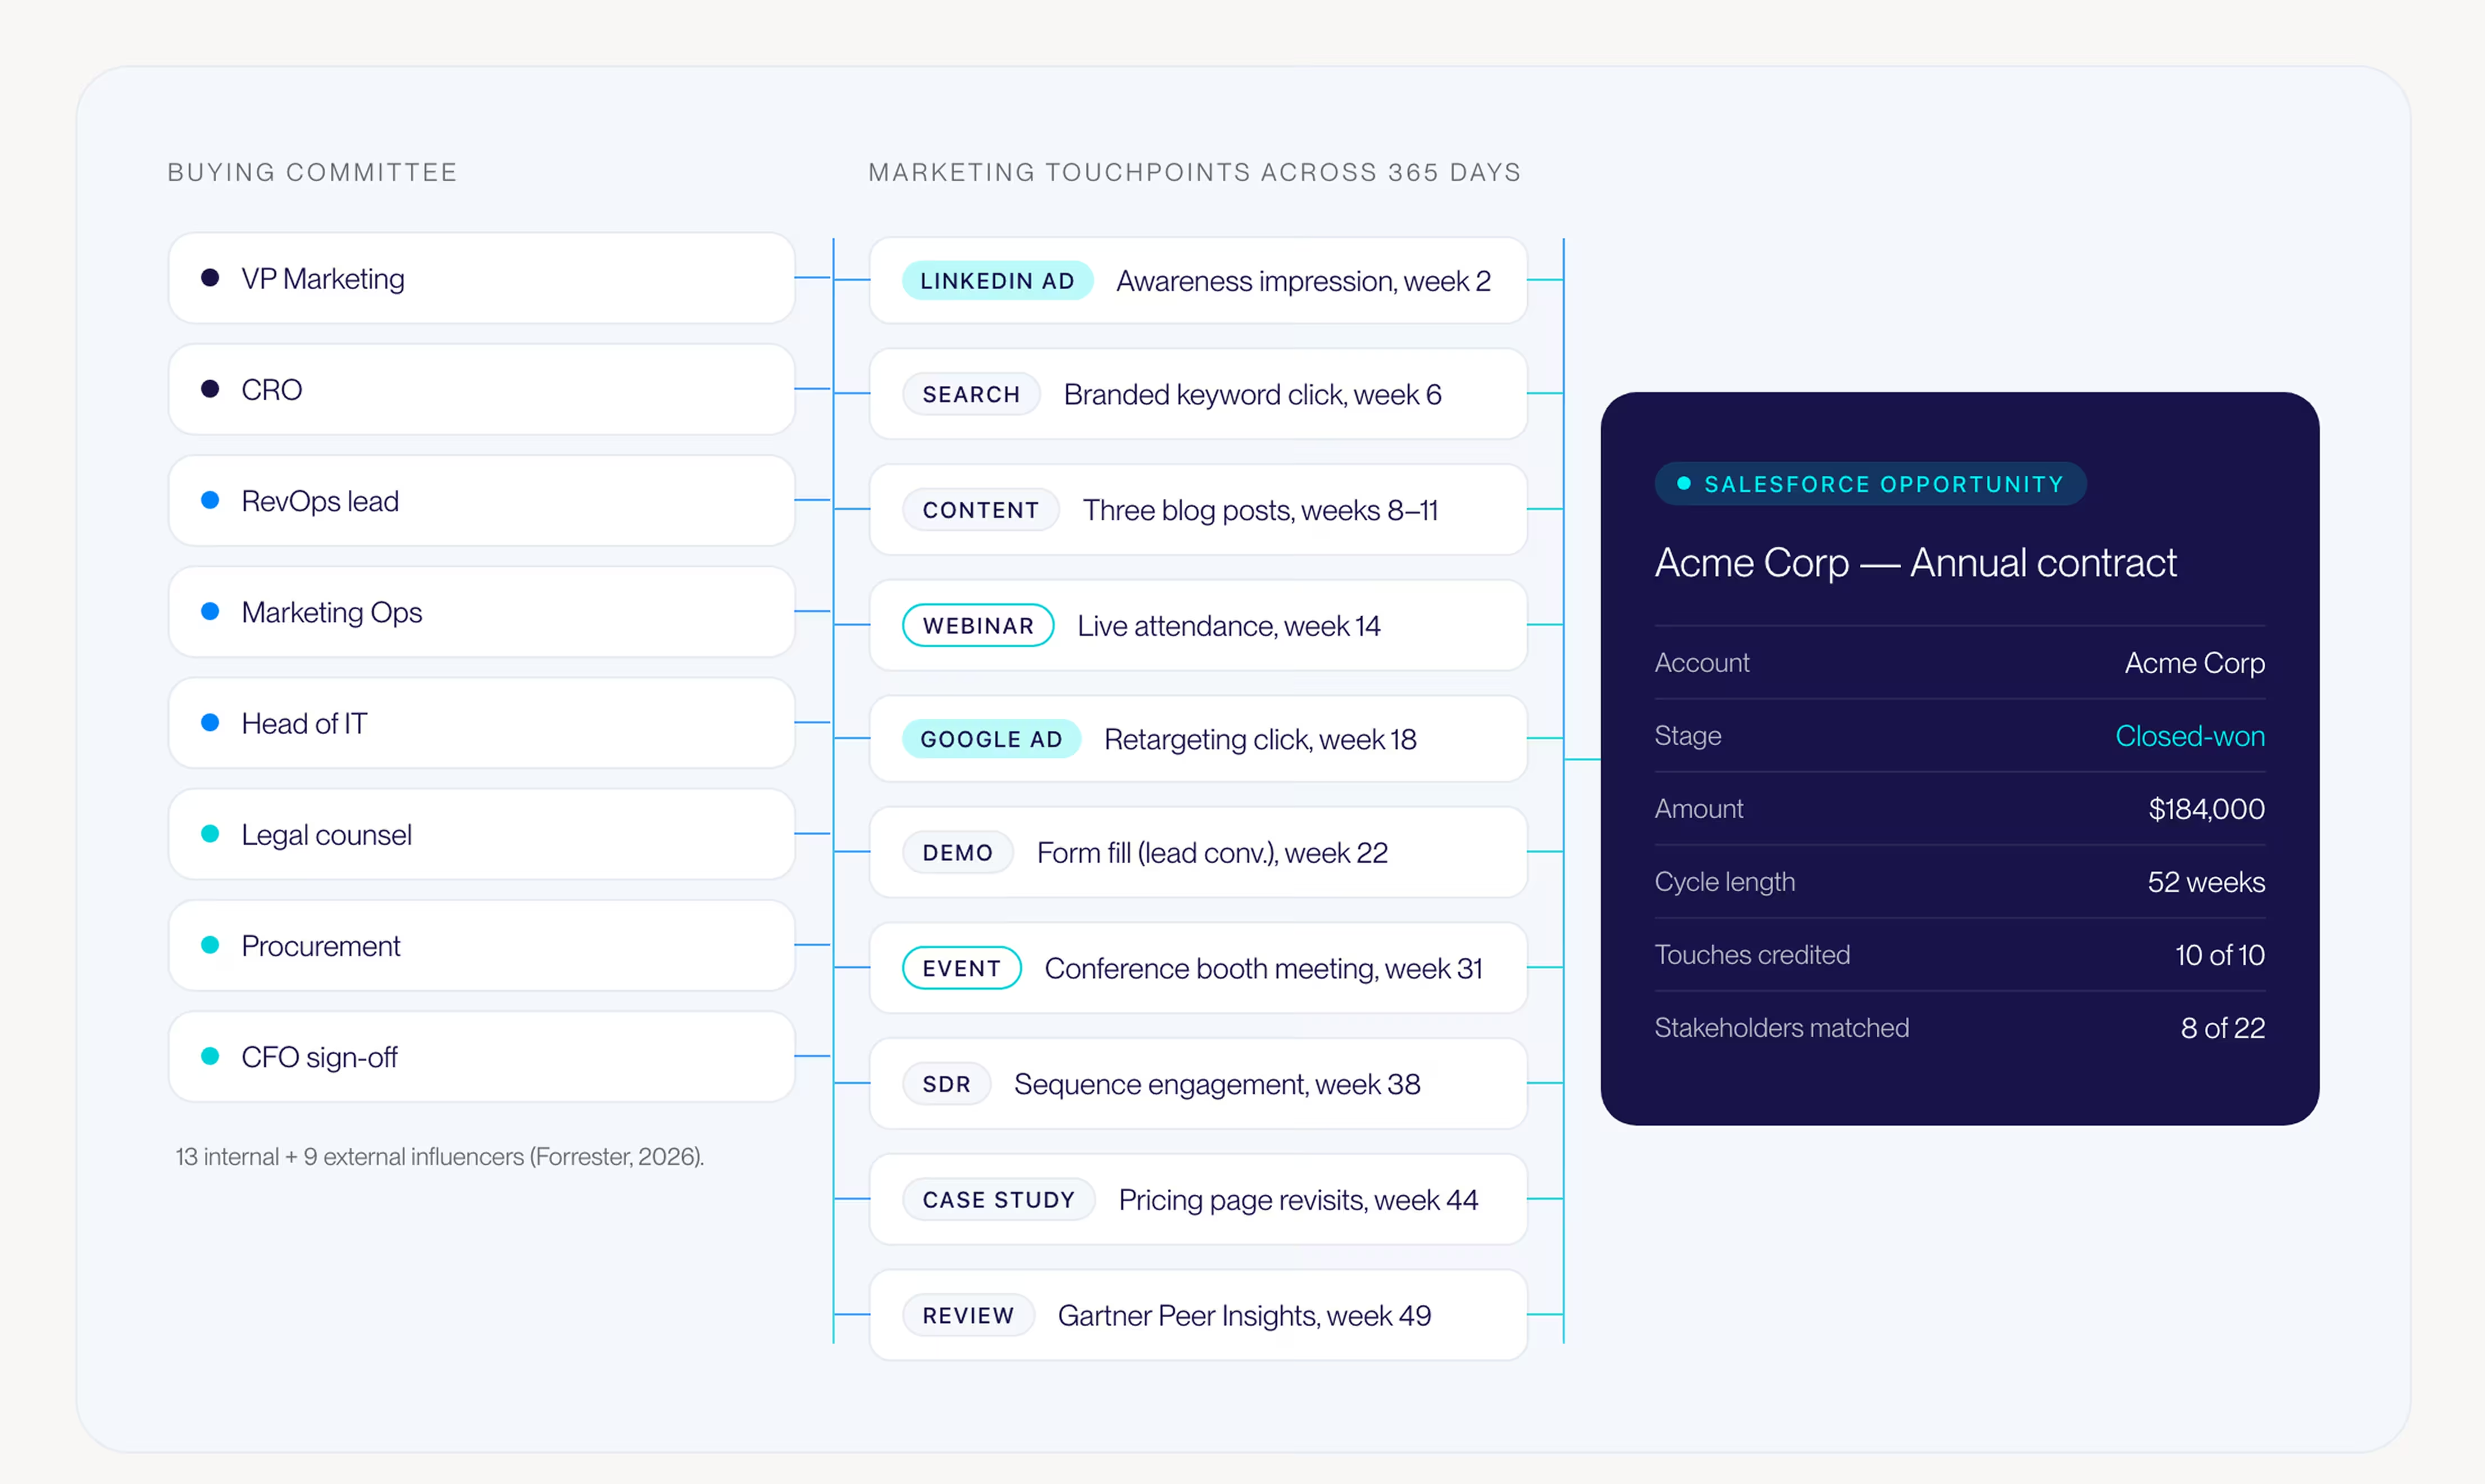
B2B marketing attribution is the system that connects every marketing touchpoint a buying committee encounters along the purchase journey to the pipeline and revenue the opportunity eventually produces. Across B2B sales cycles, journeys routinely run 6 to 18 months and involve 6 to 13 stakeholders.
Teams put an attribution system in place to answer a single question for the CRO, the CFO, and leadership: which marketing investment produced this dollar of closed-won?
The job is harder than it sounds. The same deal at a $20M ARR SaaS company will touch a paid LinkedIn ad in February, a Gartner Peer Insights review in March, three blog posts and a webinar in April, an SDR outbound sequence in May, an in-person event in June, four pricing-page visits in July, and a CFO conversation in August. Each of those touches changes the probability of closing. Each one belongs to a different team. None of them, on their own, closes the deal.
A B2B marketing attribution model is the rule for splitting credit across those touches once the deal closes. The implementation is the data architecture that collects the touches, stitches them to the right account, and stores the results in a place the CFO and the CRO can read. Without both halves, you have an opinion in a pretty slide deck.
For Vincent Coulondres, Head of Growth at Ringover, the model and the implementation came apart on a Tuesday in early 2024. Google Ads claimed dozens of conversions a week. Salesforce showed a handful of closed-won deals. Finance asked which number to put in the board deck. There was no good answer until Vincent moved attribution into Salesforce itself. After that move, Google Ads ROAS increased by 14%, and marketing-generated revenue attribution accuracy improved by 24%.
What are the benefits for B2B teams using Marketing Attribution?
Every team tied to revenue inside your org stands to gain from the clarity that attribution can provide. It can help align marketing, sales, and RevOps by enabling them to find common ground on shared definitions and by providing a central hub that credits everyone’s efforts.
The benefits for marketing teams
Data that shows impact so you can defend and scale your budget
With a system in place that gives your campaigns across channels the credit they’re due, you not only have the proof to show marketing’s impact on revenue, but also the ability to show what works and scale.
By showing leadership and demonstrating the revenue link between marketing and closed deals, you earn the confidence they need to reward you with the marketing budget you deserve to scale operations and test new strategies.
Creating a centralized hub where everyone can see what’s generating pipeline and revenue gives you the insights to optimize, and keeps things transparent by letting everyone see why you’re doubling down on certain channels, campaigns, or keywords.
This also gives CROs and CFOs the answers they need to forecast growth using KPIs such as time-to-revenue. When you help everyone around you do their jobs, it doesn’t go unnoticed.
Heeet ensures these metrics live directly in your CRM, where the rest of your org operates.
Getting the full view of the B2B customer journey
Connecting the touchpoints from first click to closed won gives you a picture of what happens pre- and post-conversion, so you can understand which combination of marketing and sales efforts brings home the deal.
With a full view, you can see what pushes opportunities through the funnel, what doesn’t move the mark, and where leads are stalling. Ensuring you can see this at the opportunity level for every deal, and also getting a global view that shows how most of your deals progress, is important for understanding what drives the majority of your deals. This also provides the ability to look at the unique journey for different products, and client typologies, because enterprise clients don’t make decisions as quick as start-ups and are usaully in need of different add-ons and features.
As mentioned above, the all-important time-to-revenue metric is measured and helps your team plan and scale. With Heeet’s Buyer Journey Analytics feature, you can visualize your impact on this metric first-hand and see how you can optimize within the comfort of Salesforce and HubSpot.
The benefits for sales teams
Understanding when to interact and what to share
By tracing the buyer journey from start to finish across every deal, sales teams can see which sales enablement content pushed a deal along and when a call or email nudged a prospect down the funnel.
With a full map of lead interactions, sales can see which leads have converted and what they interacted with, and act accordingly by personalizing outreach with relevant insights and content. Looping LinkedIn engagement into your attribution setup at the lead and opportunity levels provides sales with another channel to interact with clients who are already engaging with your brand.
Keeping sales and marketing aligned
Ensuring that both teams are working with the same source of truth provided by the same data in the same place they work day in and day out, gives sales and marketing the foundation to optimize together. Whether it's time-to-revenue, lead scoring, individual campaigns, attribution methodology, or sales enablement content, both teams have the attribution data and buyer journey analytics to see how their combined efforts drive revenue faster.
The benefits for RevOps teams
Attribution that lives in the CRM, without the custom build
RevOps owns the plumbing everyone else reports on. When attribution lives anywhere but the CRM, RevOps often inherits the reconciliation work: the CSV exports, the field mapping, the duplicate cleanup, the “why doesn’t this number match the forecast” tickets that land the week before a board meeting. Move attribution inside Salesforce or HubSpot, and everyone starts sharing the same numbers.
The native route to multi-touch attribution in Salesforce runs through Customizable Campaign Influence, which Salesforce’s own documentation calls an admin-and-developer feature. Translation: someone has to write Apex code to put it all together and maintain it. Carl Kiessig at Red & Yellow priced out building it in-house and found the job needed a senior Java engineer, but he wasn’t set up to take on the job on his own. “Why try to invent it yourself when somebody has already pre-packaged the solution?” he told us. A CRM-native layer writes the touchpoints, the model, and the credit splits straight into the records you already own. With native attribution integration in place, RevOps maintains a configuration instead of a codebase.
One source of truth stops being a slogan, and starts becoming a necessity, when you’re the team that gets blamed for three versions of the same report. The benefit of creating a centralized hub matters more than it sounds. It gives the your org the ability to move faster. Because the data lives in the CRM, leadership, sales, and finance all read the same numbers without learning a new tool. At Red & Yellow, that shared view is what allowed teams to agree on budget reallocations fast enough to act on them mid-year.
Hours back, and a number you can defend
Ask any Salesforce admin what attribution costs them, and you’ll hear a version of what Sara Slater, a Salesforce Admin and Business Analyst, lived with at Nel.
The process involved exporting thousands of rows from Pardot, and striping duplicates to filter the noise. After rebuilding everything and placing it into a PowerPoint for the global leadership team, she found herself defending conclusions she didn’t fully trust.
After Nel moved attribuion and tracking into Salesforce, that month-long process turned into a dashboard refresh. “I’ve gotten days back,” Sara said. She traded monthly reporting cycles for quarterly strategic analysis.
Trust was the bigger win. “For the first time in almost six years here, I trust what I’m putting out there. I can at least defend it,” she told us.
Some of that comes from closing a quiet failure marketing and sales teams live with: in Salesforce, an opportunity with no Contact Role gets no attribution, and the report doesn’t mention an error. It just shows nothing. When leads are automatically attached to opportunities, that gap closes before it ever reaches a slide. Heeet automates this process, so you can rest assured every opportunity shows in your attribution report.
Practical use cases : How do you turn attribution data into content that converts and ad spend that targets revenue?
You run two plays off the same CRM-native data. First, measure every content asset by the pipeline it influences, then put production budget behind the assets that show up in won deals. Second, send closed-won revenue back to Google and LinkedIn, so their algorithms bid toward customers instead of clicks. Here is how each works in practice.
Step 1: Measure content ROI in pipeline, not pageviews
Content ROI in a B2B motion is the pipeline and revenue a content asset influences on its way to closed-won, measured with a multi-touch model rather than by traffic or downloads. The reason most teams can’t answer “which asset added a dollar to the pipeline last quarter” is structural. Engagement data sits in Google Analytics. Revenue sits in the CRM. Nothing connects them.
Connect them, and three numbers replace the vanity metrics:
- Pipeline influenced by content. Which assets touched an opportunity before it was created? “Our comparison guide influenced $1.2M in pipeline last quarter” survives a budget review in a way “50,000 monthly visitors” never will.
- Content velocity. Whether deals that engage with content close faster than the ones that don’t. When content-engaged deals close 20% faster than the rest, content has a velocity story leadership can read off a chart.
- Cost per opportunity by content type. What a webinar costs to produce against the pipeline it influenced, sitting next to the same math for a blog post or an ROI calculator. This is the number that reallocates the budget.
Ringover’s SEO team saw what changed once their organic performance was tracked against revenue in Salesforce. They found that 50% of inbound leads came from SEO, 25% of the the pipeline traced back to SEO-sourced leads, and 33% of the prospects who reached the pricing page converted into opportunities. They also spotted that specific pages cited by LLMs pulled visitors who converted twice as fast. “I can see exactly which pages are driving leads, revenue, and the reporting makes it easy to measure ROI and compare with other channels,” says Fátima Muñoz Peribáñez, Ringover’s Head of SEO.
For a more granular look at you can start spotting which content converts see our SEO multi-touch attribution guide that covers the organic-search version of this play.
Step 2: Scale the content that shows up in won deals
Knowing which content influences revenue tells you where to spend the next dollar of production. The move is to read the winning journeys, identify the assets that recur in closed deals, and build more of what those assets do well.
This is where journey analytics earns its keep. When you can see the assets that appear most often in won-deal journeys, content planning stops being a guessing game. One team found that a problem-led asset, “how to prove marketing ROI to your CFO,” generated 50+ demo requests in a single quarter while their feature-led pages lagged behind. Same effort, very different return. The attribution data is what told them which one to repeat.
Russell Morgan at Nel found a smaller version of the same lesson by accident. Watching the journey data, he noticed how many prospects kept returning to Nel’s resources page before they ever filled out a form. “I realized so many people were going to that before filling in a form, so I was like, OK, I’ve got to polish this up,” he told us. A page he’d treated as an afterthought turned out to be a high-intent waypoint. He rebuilt it and added earlier conversion points. Content optimization driven by what buyers actually did on the site, the kind of signal a content calendar can’t predict.
For most B2B teams, the W-shaped attribution model makes this visible because it credits the first touch, the lead conversion, and the opportunity creation rather than collapsing the whole journey into a single event.
Step 3: Send closed-won revenue back to Google and LinkedIn
This is the play that changes what your paid budget buys. Most B2B ad accounts optimize toward the conversions the platform can see, which means clicks and form fills. The algorithm has no idea that 47 of last month’s “conversions” resulted in 4 closed deals. When you send closed-won revenue back through Google’s Enhanced Conversions for Leads and LinkedIn’s Conversions API, the bidding model starts optimizing for the customers, not the forms.
Ringover ran this exact loop. By centralizing cost tracking in Salesforce and syncing real revenue back to Google Ads, they lifted Google Ads ROAS by 14%, pulled 3x more pipeline from paid media, and grew paid’s contribution to revenue by 80%. The platform got honest input. Better bids followed.
Nel’s version is the line I repeat in demos. “We can trace million-dollar opportunities back to a specific Google ad we placed,” Russell told us. Once that link exists, lead quality becomes visible at the campaign level. Spend shifts toward the campaigns that produce six-figure opportunities.
Two moves compound the effect:
- Build audiences from revenue signalsSeed lookalike audiences with closed-won customers and qualified pipeline instead of everyone who visited the site. CRM-based lookalikes built on real buyers consistently convert at two to three times the rate of broad targeting, because you’re showing the algorithm what a paying customer looks like.
- Exclude the spend that can’t be paid backThe moment a lead is marked unqualified, or a deal closes, push it to an exclusion list so you stop paying to retarget students, competitors, and customers who already signed. One Heeet customer cut retargeting spend 30% in the first month by doing this.
Red & Yellow shows where the loop lands over a full cycle. Carl Kiessig’s team replaced last-click tracking with multi-touch attribution in Salesforce, waited about three months for the data to stabilize, then started reallocating budget based on the ROAS report. Performance Max, the campaign type Carl trusted least because the legacy system couldn’t tie it to enrollments, turned out to be his highest-returning campaign type once revenue flowed back. Paid enrollments climbed 26% year over year. Paid lead conversion went from 2.8% to 4.1%. The program drove roughly twice the enrollment of two years earlier with only 8% more budget.
“If we didn’t have this tracking in place, the results on the paid-advertising side would have been worse,” Carl said. “We probably wouldn’t have hit targets as a business.” For the cross-platform setup, see multi-touch attribution for B2B ads; for the audience-sync mechanics, see activating CRM data to optimize ad spend.
EEAT diagram brief #5: The revenue feedback loop. A circular flow showing closed-won revenue in the CRM → Enhanced Conversions for Leads and LinkedIn Conversions API → platform bidding optimizes for revenue → better-qualified leads enter the CRM. Navy #181349 background, cyan #00EFEF accents, PP Neue Montreal. Place beneath Step 3.
Why B2B marketing attribution looks different in 2026
Despite the gains you are set to make with attribution that permits the three plays mentioned above, three things changed in the last twenty-four months. None of them were on the roadmap of any attribution vendor I know.
Generative AI moved into the buyer’s seatForrester’s 2026 State of Business Buying report finds 89% of B2B buyers now use ChatGPT, Claude, Gemini, or Perplexity as a primary research tool. The shortlist gets formed inside a model conversation that no marketing tracking tool can read. By the time the demo form is filled out, the decision is often half-made. The vendor that was easiest to discover, easiest to verify, and easiest to cite has an advantage that wasn’t priced into anyone’s attribution model in 2023.
Cookie loss became permanentSafari, Firefox, and Brave killed third-party cookies years ago. Enhanced Tracking Protection, iOS App Tracking Transparency, and consent-mode requirements degrade the GCLID flow at the source. Platforms have started replacing observed conversions with modelled ones, which sounds neutral and isn’t. A model that runs on degraded input produces degraded output, and most B2B teams haven’t audited what their attribution platform is reporting against what their CRM can verify.
Sales cycles got longer and budgets are tighterThe 10 to 12 month average seen across most of Heeet’s customer base shows a pattern the industry has been quietly absorbing for years. Budgets are tightening. Buying groups went from 6 to 8 stakeholders in 2022 to 13 internal plus 9 external influencers in Forrester’s 2026 data. Procurement reviews got stricter. CFO sign-off got slower. None of that is favourable to attribution windows.
With the current B2B marketing context fresh on your mind, let’s go over the the different models and tools that you’ll need to put in place to cover these gaps in the customer journey.
What are the main B2B marketing attribution models?
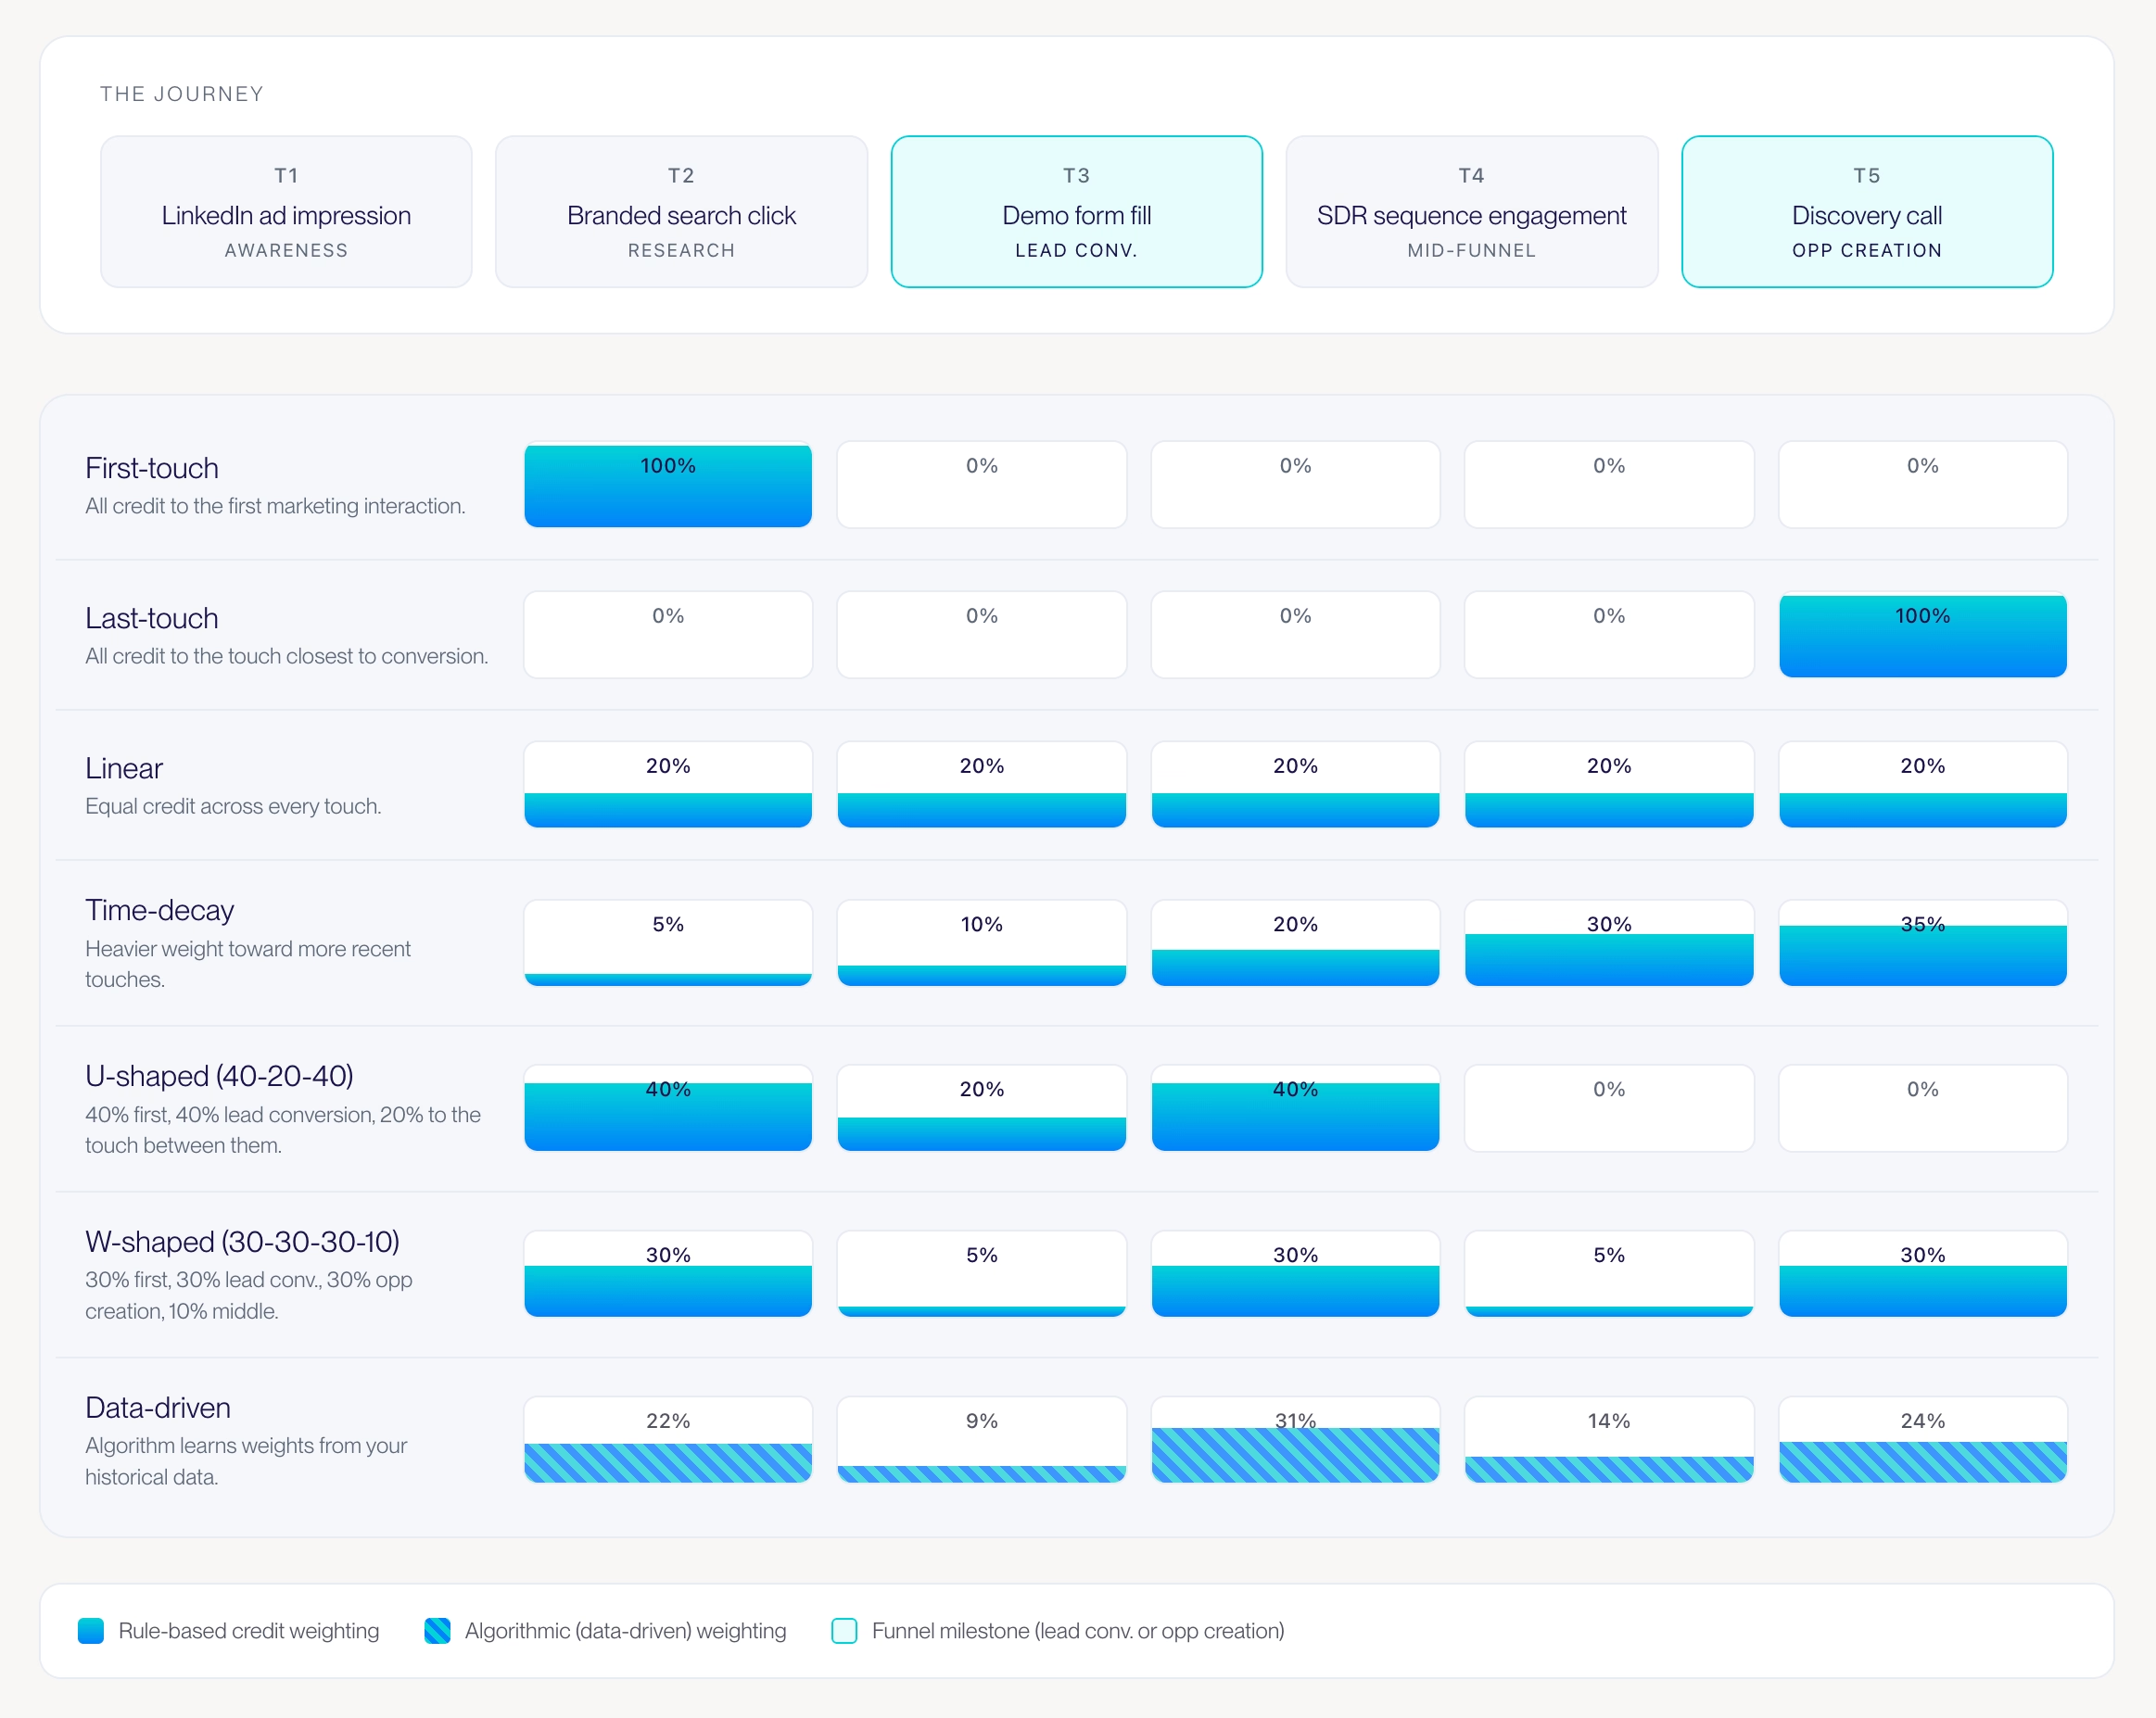
There are seven models commonly used in B2B: first-touch, last-touch, linear, time-decay, U-shaped (position-based), W-shaped, and data-driven (algorithmic). Each one is a rule for splitting credit across touches. None of them is universally correct. Each has a sales-cycle length, data quality, and stakeholder tolerance for complexity that suits it.
Long story short, it all depends on the nature of your business, the product or service you sell, and how easily it can by purchased.
Here’s the shortest honest version of each model.
First-touch attribution
In this case all credit is attributed to the first touch in the journey. This is most useful when used to understand top-of-funnel demand generation in isolation. The obvious constraint of this model for B2B is the lack of visibility leading to a sale that may have took 12 months and 30+ touches to materialize. However, when used in isolation to test top-of-funnel channels, first-touch serves as a useful tool to test new paid channels or campaigns. For more on when to use first-touch or multi-touch attribution, give our article on the subject a read.
Last-touch attribution
Here all credit goes to the final touch before the conversion. This is still the default in most CRMs and most ad platforms most likely becuase it’s an easy way to take credit for a conversion, but it’s defensible to no one once you understand the cost of flying blind before the last-touch. See last-touch vs multi-touch attribution: the real cost of getting it wrong.
Linear attribution
This model levels the playing field by giving equal credit to every touch along the journey. While it’s easy to explain, it doesn’t make sense to treat a five-second display impression the same as a one-hour demo, which is its biggest weakness. Linear can work as a defensible starting point if your data is messy and you need a model you can audit, but you’ll need to start weighing touchpoints accordingly. If you need a linear attribution model 101 refresher for in Salesforce and HubSpot, give this post a read.
Time-decay attribution
By considering the element of time, this model gives more credit to touches the closer they are to the conversion. This works for short cycles, but systematically undercredits brand and top-of-funnel work in long B2B cycles, where the decisive touch can happen months before close.
U-shaped (position-based) attribution
40% to first touch, 40% to the lead conversion event, 20% split across the middle touches. Strong when the form fill is genuinely the end of the journey. Weak when the most decisive touches happen after the lead converts, which, in B2B, is most of the time. See U-shaped attribution for B2B: when the 40-20-40 model delivers.
W-shaped attribution
What we call the beginning, the middle and the end model, W-shaped attributes 30% to first touch, 30% to lead conversion, 30% to opportunity creation, and splits the remaining 10% across the middle. This the first model that can clearly credit post-form-fill activity on it’s own, which makes it the cleanest fit for the average B2B sales motion. See W-shaped attribution: the pipeline model.
Data-driven (algorithmic) attribution
Uses machine learning on your historical conversion data to learn the actual contribution of each touchpoint. The most accurate model when you have the volume to train it on, and a black box when you don’t. See data-driven attribution vs deterministic models.
For B2B SaaS specifically, the choice usually comes down to W-shaped versus data-driven, and the right answer depends on deal volume. See the best attribution model for B2B SaaS.
Single-touch vs multi-touch attribution in B2B
Single-touch attribution credits one touchpoint for the entire deal. Multi-touch attribution distributes credit across every touch that contributed. For B2B, single-touch is wrong most of the time, and being wrong costs money.
The math is simple. If a deal involves twelve touchpoints across eight months and you credit the entire revenue to the last form fill, you’ve told your team that eleven of the touches don’t matter. You’ll cut the budget for whichever of those eleven were paid, and you’ll watch the pipeline they fed dry up two quarters later. By the time you connect the cause to the effect, the campaigns that produced the pipeline are gone, and the metric that helped you decide was wrong in the first place.
I see this pattern in nearly every paid-media demo our team runs. A marketing lead opens Google Ads on one screen and Salesforce on the other. Google Ads reports 47 conversions in the last month. Salesforce shows 4 closed-won deals in the entire paid program over the same window. The marketing lead pauses. The CFO walks in to ask which number to put in the board deck. There is rarely a good answer until the team commits to multi-touch.
That doesn’t make single-touch models useless. First-touch is useful when you want to understand top-of-funnel awareness in isolation. Last-touch tells you what closed the deal. Both can sit as secondary models in a stack where multi-touch is the primary read. They just can’t be the primary read in a B2B motion.
What makes B2B multi-touch marketing attribution different?
It differs from B2C multi-touch attribution in three structural ways: it operates at the account level rather than the individual level, it credits touches across the full sales cycle rather than within a fixed window, and it tracks post-form-fill activity rather than stopping at the lead conversion.
In practice, that translates into specific requirements your tooling has to meet:
- Account-level rollup. Every touch on every lead at a given company must be attached to the same Salesforce or HubSpot account record. Tools that report per-lead miss the buying group.
- Opportunity-stage tracking. Touches that occur after the lead becomes an opportunity must continue to be captured and credited. In B2B, the touches between Stage 2 and Stage 4 are often the ones the rep would tell you mattered most.
- Cross-channel stitching. The buyer journey is never confined to a single channel. Paid LinkedIn, organic search, a Gartner review, an SDR cadence, a webinar, and an event can all touch the same account in one quarter. Attribution that only reads one channel is a single-channel performance report.
- Cycle-fitting attribution windows. A 90-day window doesn’t help when the average cycle is 365 days. Windows have to fit the cycle, not the platform default.
The multi-touch attribution checklist for B2B covers the seven questions worth asking any vendor before signing a contract. They’re the questions Maxime, Thomas, and I wish more prospects had asked us in the first demo, because the answers tell you whether the tool was built for B2B or rebranded from B2C the week before launch.
Multi-touch attribution vs marketing mix modelling: when to use which
For those confusing the use of the following tools, Multi-touch attribution (MTA) and marketing mix modelling (MMM) answer different questions. MTA answers, “Which specific touch contributed to this specific deal?” MMM answers “what is the aggregate effect of each channel on revenue, accounting for diminishing returns and lag?” Mature B2B teams in 2026 run both, plus incrementality testing on top.
MTA is sharper at the campaign level. It tells you which paid LinkedIn campaign, which Gartner placement, and which webinar series produced the pipeline you measured this quarter. The granularity is unmatched. The weakness is that it sees only what it can track, and a meaningful slice of B2B influence happens in untracked channels: peer recommendations, Slack communities, private podcasts, conference hallway conversations. MTA reports none of it.
MMM is the opposite. It works at the channel level using aggregate data, so it can read brand spend, offline events, sponsorships, and any other channels that don’t provide a clean click-to-conversion trail. It’s the right tool for annual budget allocation and for measuring categories that MTA can’t see. Its weakness is granularity. MMM tells your subway ad campaign in the city hosting an industry event was worth while. It doesn’t tell you which exact client signed because of it.
Incrementality testing is the third leg of the stack. Geo-holdouts, ghost-bid tests, and matched-market experiments measure the actual lift a channel produced relative to a baseline when it didn’t run. The output is causal rather than correlational. It’s the closest thing to ground truth available, and the methodology requires statistical discipline most teams don’t have in-house.
Data-driven vs deterministic attribution: which approach in 2026?
Data-driven attribution uses machine learning to learn each touch’s contribution from your historical conversion data. Deterministic attribution applies a fixed rule (first-touch, last-touch, U-shaped, W-shaped, linear, time-decay) that you choose up front. In 2026, data-driven is more accurate when you have the volume to train it; deterministic is more defensible when you don’t.
The volume threshold matters more than the marketing material usually suggests. Google’s documented minimum for data-driven attribution at the ad platform level is 300 conversions and 3,000 ad interactions over the last 30 days. For data-driven attribution at the revenue level (closed-won deals, not form fills), you typically need at least 200 to 300 closed-won opportunities a year with a consistent journey shape before the model produces stable weights. Most mid-market B2B teams don’t hit that threshold across their full mix, which is why deterministic models still hold the line in the segment.
The defensibility question is the other reason deterministic models survive. When the CFO asks why marketing got 30% credit for a deal, “because the W-shaped model assigns 30% to the first touch and Account X first touched us through LinkedIn” is an answer the CFO can audit. “Because the algorithm learned that LinkedIn matters” is not. The model’s defensibility is a real factor in whether your attribution gets used or filed.
The pragmatic answer for most mid-market B2B teams: start with W-shaped, move to data-driven when your deal volume justifies it, and document the model so the CRO and the CFO can both read it. The full comparison sits in data-driven attribution vs deterministic models.
Self-reported (blended) attribution: the supporting cast you need
Self-reported attribution asks buyers directly how they heard about you, then blends those answers with your tracked-touch data. It exists because no tracking layer can see Slack, private podcasts, peer recommendations, or hallway conversations at events, and those channels drive a meaningful share of the B2B pipeline. Industry estimates put the dark-funnel share between 38% and 51%.
The mechanics are simple: a “How did you hear about us?” field on the demo form, a follow-up question during the sales-qualification call, and a closed-won survey. The discipline is in the implementation. Most teams add the field, get 80% “Google search” or “I don’t remember” answers, and conclude the data is worthless. The fix is to limit the options to recognizable categories (events, peer recommendation, podcast, search, social, paid, content) and to ask again at three points in the cycle, so a buyer who can’t remember in week one can answer in week eight when they’re closer to a decision.
The blended part is where the value lands. Self-reported attribution, by itself, overweights recency: buyers report the most recent prompt that prompted them to act. Tracked attribution underweights anything it can’t see. Blending the two produces a read that catches both halves. Self-reported data routes credit to channels your tracking can’t reach. Tracked data corrects for recency bias in self-reports.
The blended B2B attribution setup covers the implementation in depth. The short version: treat self-reported data as a co-star, not the lead. The cast you need has both.
How to implement first-party data in B2B marketing attribution
First-party data is the data you collect directly from your buyers on your own infrastructure: form submissions, on-site behaviour, email interactions, CRM activity, and customer surveys. In 2026, it’s the only reliable foundation for B2B attribution, because every third-party signal has degraded. The implementation question is no longer whether to build on first-party data. It’s about organizing the collection so the attribution model has what it needs.
The minimum first-party data architecture for B2B attribution has four layers:
- Identification. A first-party tracker on every page, which captures the visitor’s identity when they fill a form, click an email link, or get matched via reverse-IP. The capture has to survive cookie loss and changes in consent mode.
- Stitching. A logic layer that connects anonymous sessions to the identified record once identification happens, and that connects multiple leads at the same company to a single account. Without stitching, you have leads with no journeys.
- Storage. A schema in Salesforce or HubSpot that holds the touchpoint records on the lead or contact, attached to the account, and retrievable by the opportunity. This is the layer most teams underbuild.
- Activation. A way to push the data back to ad platforms (Enhanced Conversions for Leads, LinkedIn Conversions API, Meta CAPI) so platform algorithms can bid on revenue rather than on form fills.
The first-party data guide for multi-touch attribution walks through the implementation step by step. The architecture is the prerequisite for everything else in this article. Skip it, and the rest is sandcastle.
Why cookieless attribution is essential for B2B in 2026
Cookieless attribution captures and stitches the buyer journey without relying on third-party cookies or browser-side identifiers that privacy controls and platform changes can strip. In 2026, every serious B2B attribution implementation has a cookieless layer underneath, because the alternative is a slow, gradual decline in accuracy that the team won’t notice until the board meeting.
The signals that degraded over the last two years:
- Third-party cookies. Killed in Safari and Firefox years ago. Chrome’s deprecation timeline is in flux, but the effective loss has already occurred: roughly half of global browser traffic doesn’t support third-party cookies. Models built on them are now extrapolating from half the data.
- GCLIDs. The Google Click ID gets stripped during consent-mode bounces, ITP redirects, and some link-cleaning email clients. A meaningful share of paid clicks now arrive at the destination without a GCLID. Offline conversion import silently underreports as a result.
- Email open pixels. Apple Mail Privacy Protection inflates open rates to the point where they’re no longer a reliable engagement signal. Click data is still real. Open data isn’t.
- Cross-device matching. Without third-party cookies, matching a phone session to a laptop session for the same person requires either a logged-in identity (most B2B sites don’t have one) or a first-party identity graph (most B2B teams don’t have one either).
The fix is first-party tracking, server-side capture, and a CRM-native data foundation that doesn’t depend on the browser to remember who the visitor is. The full implementation sits in cookieless attribution for B2B.
There’s a specific channel where the cookieless layer earns its keep fastest: organic search. An SEO-driven B2B pipeline is hard to attribute under cookie loss because the journey often spans multiple sessions and devices before a form fill. The SEO multi-touch attribution guide covers how to credit organic search across long journeys without the third-party cookie crutch. There’s a related play for paid: multi-touch attribution for B2B ads covers the cross-platform side of the same architecture.
B2B marketing attribution for Salesforce
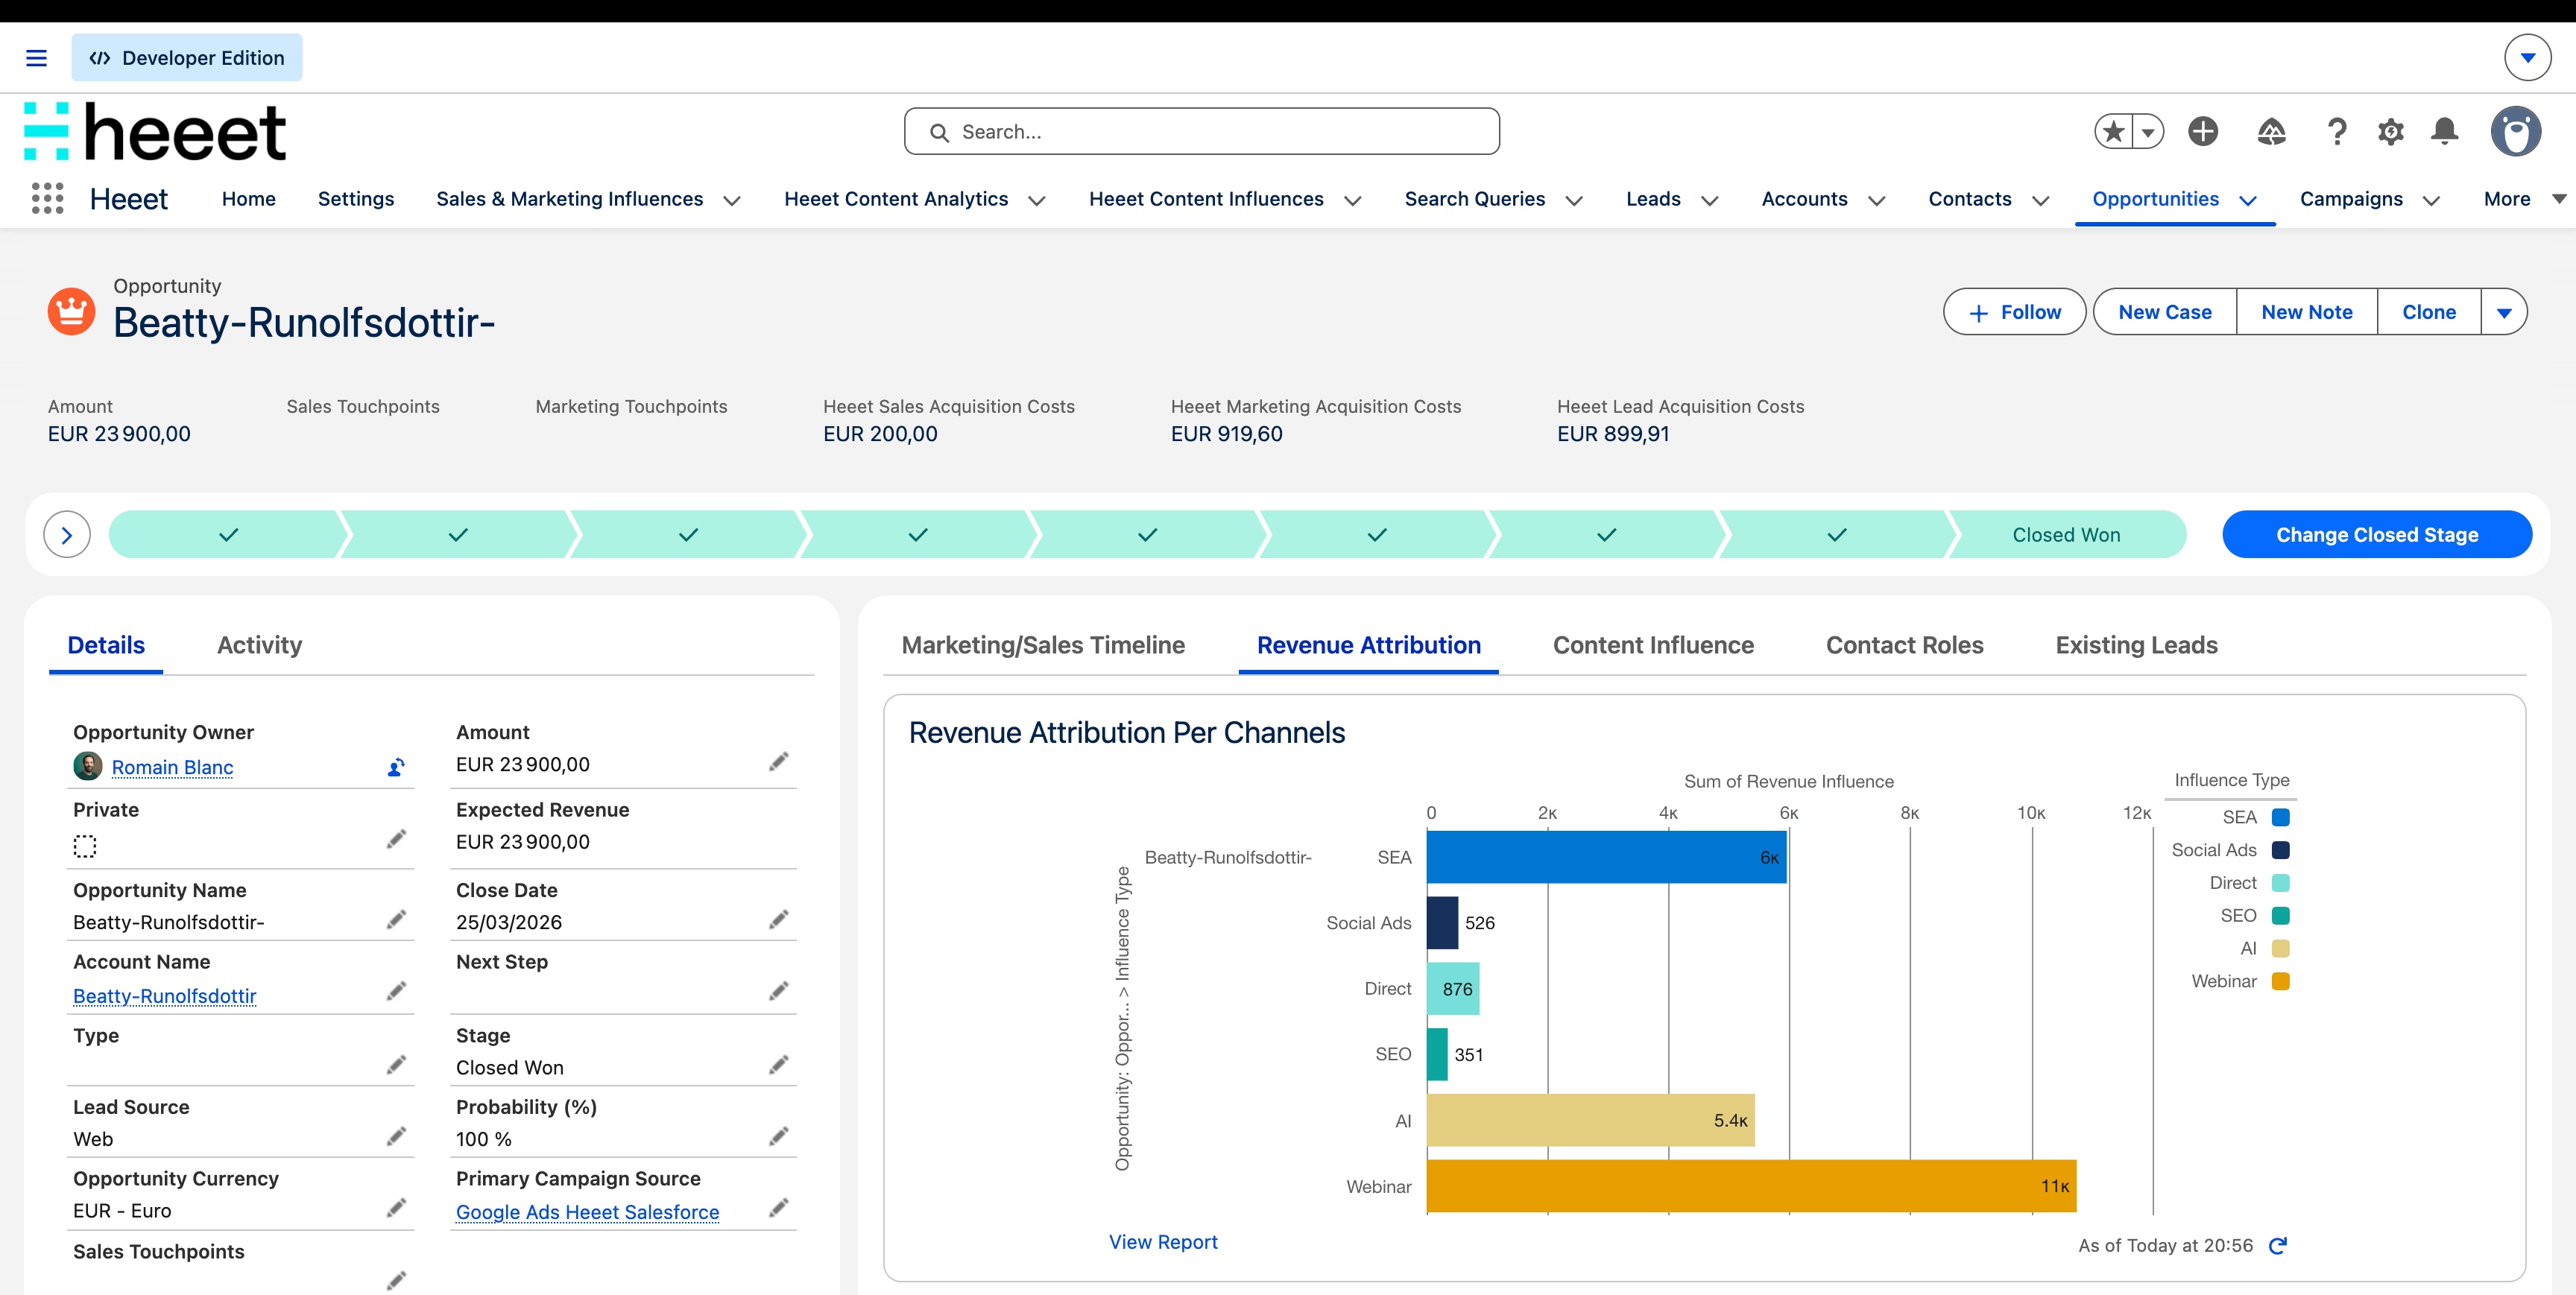
B2B marketing attribution for Salesforce is the practice of capturing, computing, and reporting marketing influence within the Salesforce CRM itself, using Campaign objects, Campaign Influence, and (in most cases) a packaged attribution app that fills the gaps left by Salesforce’s native functionality. The CRM becomes the system of record for marketing data, not a downstream consumer of someone else’s report.
Salesforce ships three things out of the box that matter for attribution:
- Campaign object. Stores the campaigns you run. Connects to Leads, Contacts, and Opportunities via Campaign Members.
- Campaign Influence (1.0 and 2.0). Stores the records that say “this Campaign influenced this Opportunity,” with a percent-credit field. 1.0 supports a primary-source rule. 2.0 supports multiple campaigns crediting one opportunity, which is the prerequisite for any multi-touch model.
- Customizable Campaign Influence (CCI). Let's you define your own attribution model in code. Powerful, and explicitly an admin-and-developer feature. Salesforce’s documentation says the quiet part out loud: you have to build the model yourself.
What Salesforce doesn’t ship out of the box: a way to capture marketing touchpoints from your website, ad platforms, content tools, webinars, and events into the CRM in the first place. A way to stitch anonymous sessions to identified leads. A way to feed closed-won revenue back to Google Ads, LinkedIn, and Meta so platform algorithms can bid on revenue rather than form fills. A multi-touch model that runs without an admin writing custom Apex.
Those are the gaps a CRM-native attribution layer fills. Heeet’s CRM-native attribution package for Salesforce captures every touchpoint, stitches sessions, writes to Campaign Influence with a chosen multi-touch model, and routes revenue back to the ad platforms. Vincent at Ringover ran this exact setup and lifted Google Ads ROAS by 14% and attribution accuracy by 24% in 2024. Carl Kiessig at Red & Yellow, a Cape Town business school running on Salesforce and Pardot, replaced a last-click model that couldn’t trace Performance Max with the same CRM-native multi-touch architecture. Inside three months, Carl had a ROAS report he trusted enough to act on. Inside a year, paid enrollments were up 26%. Performance Max went from the campaign type Carl distrusted most to the one with the highest ROAS in his stack.
The deeper comparison of native Salesforce capabilities versus what a packaged layer adds sits in how CRM-native attribution works inside Salesforce and HubSpot.
B2B marketing attribution for HubSpot
B2B marketing attribution for HubSpot is the practice of building multi-touch attribution inside the HubSpot CRM using HubSpot’s native Multi-Touch Attribution Reports as the foundation and (in most cases) a packaged attribution app that extends what HubSpot tracks and writes back to ad platforms. HubSpot ships more attribution capability natively than Salesforce does, but the same architectural gaps exist.
HubSpot’s native attribution model menu includes first interaction, last interaction, linear, U-shaped, W-shaped, time-decay, J-shaped, inverse J-shaped, and full-path. The model selection is wider than Salesforce’s. The reporting interface is friendlier. Marketing Attribution Reports are gated behind the Enterprise tier, which is a price most mid-market teams haven’t budgeted for.
Where HubSpot’s native attribution falls short for serious B2B:
- Channel coverage. HubSpot can read what its tracking script captures. Webinar platforms, in-person events, ABM platforms, intent-data tools, and offline campaigns need separate integrations and manual stitching.
- Account-level rollup. HubSpot’s contact-centric data model can make it harder than it sounds to roll touches from multiple contacts within a single account into a single Deal record.
- Revenue feedback to ad platforms. HubSpot reports on its own data. Routing closed-won revenue back to Google Ads, LinkedIn, and Meta so their algorithms can bid on revenue requires further setup.
- Cookieless tracking. HubSpot’s tracker is improving, but it still relies too much on browser-side identifiers, which a cookieless architecture should not.
A packaged attribution layer addresses each of these. Heeet’s HubSpot integration captures cross-channel touchpoints, stitches them to the contact and the company, writes a multi-touch model into the Deal record, and pushes revenue back to the ad platforms. Implementation runs in hours rather than weeks.
The full HubSpot-side architecture sits in the native attribution gap article, alongside the Salesforce comparison.
How do you implement B2B marketing attribution in Salesforce or HubSpot?
Most mid-market B2B teams can stand up a working multi-touch attribution model in their CRM in roughly 30 days, broken into a three-week implementation sprint plus a one-week governance setup. The bottleneck is rarely the technology. It’s the seven foundations that have to be in place before any attribution model produces output you’ll trust.
A working 30-day rollout looks like this:
Week 1: Foundation audit. Audit the data hygiene that the model will run on. Lead source completion, campaign association rates, duplicate-record percentage, and opportunity-stage definition consistency. Production teams target 95%+ lead source completion, 80%+ campaign association on closed-won, and under 5% duplicate records. If you’re below any of those, fix the foundation before you instrument the model.
Week 2: Instrumentation. Install the tracking script. Connect the ad platforms (Google Ads, LinkedIn, Meta). Connect the webinar tool, the event tool, and the marketing automation platform. Configure the touchpoint capture rules. Verify that touches are landing on the correct Lead and Contact records.
Week 3: Modelling and reporting. Pick the model (W-shaped is the safest default for B2B; revisit data-driven once you have volume). Configure the model in the CRM. Build the reports the CRO and the CFO will read. Test against ten recent closed-won deals and verify that the credit splits match what the rep would tell you happened.
Week 4: Governance. Set up the attribution council, a monthly review meeting with marketing, sales, and finance present, where the team reviews how the model assigned credit to the previous month’s closed-won deals. Without governance, the model decays. With it, the model gets sharper every cycle.
The full 30-day playbook lives in CRM-native attribution: build the revenue advantage in 30 days, with the week-by-week task list, the readiness checks, and the rollout sequence we walk customers through.
What’s working in 2026: a co-founder’s view from inside the demo room
A few patterns from the last two quarters of customer conversations, written down because they’re easier to act on as observations than as benchmarks.
The teams that started with hygiene wonEvery successful attribution rollout I’ve watched in the last twelve months started with two boring weeks of data cleanup. The teams that skipped this step and went straight to model selection produced reports that the CRO didn’t trust. The teams that audited first, then instrumented, then modelled, produced reports that the CRO read. The order matters more than the model choice.
The CRM is the only durable source of truthEvery dashboard tool, every BI build, every Looker rebuild I’ve seen in the last two years gets replaced inside eighteen months. The CRM record outlasts all of them. The CFO trusts the CRM’s pipeline data. The CRO forecasts off it. If attribution doesn’t live there, it’s somebody’s side project.
Ad platforms reward teams optmizin for revenue form the CRMGoogle’s Enhanced Conversions for Leads, LinkedIn’s Conversions API, and Meta’s CAPI all let you route closed-won revenue back to the platform so the bidding algorithm can optimize for revenue instead of form fills. Teams that do this get materially better-paid media performance. Teams that don’t are still optimizing for MQLs when MQLs don’t predict revenue.
The dark funnel is not a measurement problemPeer recommendations, Slack communities, private podcasts, and event hallway conversations drive B2B pipeline. None of it shows up in your attribution model. The right response isn’t to try to measure it. It’s to invest in being the brand that gets recommended, then read the lift in self-reported attribution and the brand search line in your Google Ads report. The measurement comes downstream of the work.
Generative AI is the new top of the funnel. 89% of B2B buyers use ChatGPT, Claude, Perplexity, or Gemini as a primary research tool, per Forrester’s 2026 data. Some of that traffic will be readable through referrer headers in 2027. None of it is fully readable today. The competitive move is to ensure your brand, your category position, and your differentiators are present in the training corpus and crawlable on your own site. Attribution will catch up to the AI funnel. The visibility work has to start before it does.
That’s the version of the answer I’d give to a peer at a dinner. It’s the version that lives behind every demo our team runs.
Frequently asked questions about B2B marketing attribution
**What is the best attribution model for B2B?**For most mid-market B2B teams, the W-shaped model (30% first touch, 30% lead conversion, 30% opportunity creation, 10% across middle touches) is the strongest default. It maps cleanly to a B2B funnel, with clear opportunity stages and credits post-form-fill activity, where most decisive touches occur. Data-driven attribution outperforms W-shaped once you have 200 to 300 closed-won deals a year with a consistent journey shape. See the best attribution model for B2B SaaS.
**How long does a B2B marketing attribution implementation take?**A working multi-touch attribution model inside Salesforce or HubSpot can be live in roughly 30 days for most mid-market teams. The split is typically 1 week of data audit, 1 week of instrumentation, 1 week of modelling and reporting, and 1 week of governance setup. The bottleneck is usually data hygiene, not the technology. See the 30-day CRM-native attribution playbook.
**Can Salesforce do multi-touch attribution natively?**Salesforce ships Campaign Influence 1.0, 2.0, and Customizable Campaign Influence, which together provide the data model for multi-touch attribution. Native Salesforce does not ship the touchpoint capture, cross-channel stitching, or multi-touch model out of the box, or revenue feedback to ad platforms. Teams typically run a packaged attribution layer on top of Salesforce to fill those gaps. See native attribution in Salesforce and HubSpot: limits and alternatives.
**Can HubSpot do multi-touch attribution natively?**HubSpot Enterprise ships Multi-Touch Attribution Reports with 9 models: first, last, linear, U-shaped, W-shaped, time-decay, J-shaped, inverse J-shaped, and full-path. Native HubSpot attribution still depends on what the HubSpot tracker can read, which leaves gaps for offline events, webinars, ABM platforms, and revenue feedback to ad platforms. A packaged attribution layer fills the gaps.
**What is the difference between multi-touch attribution and marketing mix modelling?**Multi-touch attribution (MTA) credits specific touchpoints in a specific buyer’s journey. Marketing mix modelling (MMM) measures the aggregate effect of each channel on revenue at a portfolio level. MTA is sharper for campaign-level optimization. MMM is sharper for annual budget allocation and for measuring offline or brand channels. Most mature B2B teams in 2026 run both. See MTA vs MMM.
**How does cookieless attribution work for B2B?**Cookieless attribution relies on first-party tracking, server-side capture, and a CRM-native data foundation that doesn’t depend on third-party cookies or browser-side identifiers. The implementation captures visitor identity when a form fill, email click, or reverse-IP match occurs, stitches anonymous sessions to that identity after identification, and stores the touchpoint history on the lead and account records in Salesforce or HubSpot. See cookieless attribution for B2B.
**Is data-driven attribution better than rule-based attribution?**Data-driven attribution is more accurate when you have the volume to train it (typically 200 to 300 closed-won deals a year with a consistent journey shape). Below that threshold, rule-based models like W-shaped are more stable and more defensible to a CFO. Most mid-market B2B teams should start with W-shaped and move to data-driven once deal volume justifies it. See data-driven attribution vs deterministic models.
**What is the dark funnel in B2B attribution?**The dark funnel is the set of buyer interactions that happen in channels marketing tracking cannot read: Slack communities, peer recommendations, private podcasts, conference hallway conversations, and generative AI assistant queries. Industry estimates put the dark funnel share of the B2B pipeline between 38% and 51%. The standard mitigation is a combination of self-reported and tracked attribution. See the blended B2B attribution setup.
The bottom of this article is the top of yours
There is no one right B2B marketing attribution model. There is a right direction, and it’s the same for every team I’ve watched go from spreadsheet to system in the last two years. The CRM is the home. The model is the rule. The first-party data is the foundation. The seven cluster articles linked below go a layer deeper into each of those, and the 30-day playbook is the path through them.
If you’d like to see what CRM-native, multi-touch B2B marketing attribution looks like on your Salesforce or HubSpot instance, we run live demos five days a week. Bring a real question, and we’ll show you a real answer.
Book a demo with the Heeet team →
Other articles

Multi-Touch Attribution Models: Calculate B2B Channel ROI (2027)
Compare multi-touch attribution models and learn the exact formulas to calculate channel ROI across your B2B funnel in Salesforce or HubSpot
15 Marketing Attribution Tools for B2B Teams (2027)
Compare 15 marketing attribution tools for B2B teams. Review CRM workflows, product fit and the questions to ask before buying.

Best Attribution Model for B2B SaaS: Finding Revenue Drivers in 2027
B2B SaaS deals are rarely simple. That’s why ensuring you have the best attribution model suited to your B2B sales cycle is essential to give you clarity
.svg)
Ready to track prospects from lead to close with Heeet?
Heeet gives marketers and sales professionals at IT & Security firms turn geuss work intro informed decisions that drive revenue while meeting the same secruity technical standards you provide your clients.