

Read time :
B2B Revenue Metrics in 2026: A CRO's Roadmap to the 15 KPIs That Predict Revenue
I've sat in the CRO seat through three growth stages, and the B2B revenue metrics that mattered at each were almost completely different. Dashboards that worked at $2M ARR actively misled my board at $20M. Most articles list 15–25 KPIs with no guidance on which to track first or when to add the next layer.



This is the prioritizing roadmap I wish I'd had. I've also included some of the most recent benchmarks we could find from Ebsta, SaaS Capital, Chart Mogul, and the Fullcast / Pavilion 2026 GTM Benchmarks Report, so you can see where you sit relative to the B2B median.
Remember to take any benchmark with several grains of salt. While benchmarks may be an indication, they don't reflect the reality of every B2B industry; they're just there to give you a rough idea. Forecasting your company's growth based on its own specific circumstances, revenue and growth goals is what matters most.
The 15 metrics below are ordered by the sequence in which a revenue leader should adopt them.
Skip ahead to the tier that corresponds to your stage.
The 4–tier roadmap for prioritizing metrics
Most revenue leaders track three metrics and miss warning signs, or track 25 and lose sight of what's most important. The right number is "the smallest set that lets you make next quarter's decisions," and that set grows with your company.
There are two rules you don't want to learn the hard way: you can't skip tiers (predictive metrics built on bad foundations will be consistently wrong), and if you add tiers, you don't replace them. These metrics work like a ladder for measuring your company's revenue growth at every stage. CROs who still care about win rate are laying the foundation for their forecast and helping leadership map where they can grow.
Tier 1 – Foundational
1. Closed–Won Revenue (by Source)
Total revenue from deals marked closed–won, broken down by source, channel, and campaign.
CRO move: Start tracking the acquisition channel from your first deal. This ensures you can accurately identify the sources of your pipeline later, without having to reconstruct data you should have gathered from the beginning. Whether you're working with first–, last–, or multi–touch attribution, this top–of–funnel signal shows you where your deals originate.
2. Win Rate (by channel, by deal size)
Percentage of qualified opportunities that close–won.
Here's the 2026 reality (Fullcast / Pavilion 2026 GTM Benchmarks): Win rates dropped 13.5% year–over–year, contributing to an overall 28% decline in sales efficiency across the 316–company, 361K–opportunity dataset. The single most damaging cause: ICP misalignment, which the report shows can cut win rates by up to 75% when sellers spend time on accounts that don't structurally fit. (Fullcast / Pavilion 2026)
If your win rate is sliding, the first place to look isn't rep performance. It's whether the pipeline you're qualifying still maps to the customers you actually win.
Rule of thumb: when the win percentage keeps climbing, it may be time to see how your product can start taking on the features that enterprise customers need, so you can look at cross–sell and up–sell opportunities. This ties into the Expansion Revenue Rate metric further down the list. If you've run into this issue, consider it a great problem to have. Time to innovate.
CRO move: Never average the win rate across deal sizes. A 35% SMB rate and a 12% enterprise rate average to "23%" doesn't describe motion accurately.
3. Average Sales Cycle Length (by segment)
Days from opportunity creation to closed–won. Track separately for SMB (30–60 days), mid–market (60–120), and enterprise (120–270).
Watch the trend, not the absolute. Average sales cycles lengthened 6.9% year–over–year in 2026, and the Fullcast / Pavilion 2026 GTM Benchmarks data shows the cost of letting deals drift: lost deals consume 225 days on average, versus 115 days for won deals. That's 2.0x more selling capacity sunk into deals that never close. A deal that slips a quarter is far more likely to never close at all.
4. Pipeline Coverage Ratio
Pipeline value ÷ Revenue target, and always include a buffer.
Calculate by dividing pipeline value by your revenue target. Benchmarks: SMB 2x–3x, mid–market 2.5x–4x, enterprise 3x–5x. This ratio helps determine whether your pipeline is robust enough to hit your quarter's goals.
CRO move: Set your pipeline coverage target as the inverse of your win rate, plus a buffer. For example, if your team closes 25% of qualified pipeline, you need a 4x coverage ratio, not just "3x" because it's conventional wisdom. Coverage targets should be based on actual conversion rates, not arbitrary rules.
One important nuance from the Fullcast / Pavilion 2026 data: bigger isn't always better. Sellers managing oversized pipelines close at 0.87x the win rate of sellers with balanced pipelines (1.37x). Coverage that overloads reps actually erodes conversion. Track coverage and capacity per rep, not just aggregate pipeline.
Tier 2 – Efficiency
Once the engine works, the question shifts from "are we closing deals?" to "are we closing deals profitably?" These are the metrics your CFO will start asking about.
5. Customer Acquisition Cost (CAC), by Channel
Sales + marketing spend ÷ new customers acquired. Always cut by channel.
CRO move: Track fully–loaded CAC, including SDR salaries, AE base, marketing tooling, and management overhead allocation. The "marketing program spend ÷ new customers" version is vanity math.
The Fullcast / Pavilion 2026 GTM Benchmarks make the channel–level cut even more critical: efficiency varies by nearly 7x across pipeline sources. Partner referrals show 1.6x sales efficiency. BDR outbound? 0.2x. If your blended CAC looks "fine" but you haven't broken it down by source, you're almost certainly subsidizing a low–efficiency channel with a high–efficiency one.
6. CAC Payback Period
Months to recover acquisition costs from gross–margin revenue: CAC ÷ (ARR per customer × Gross Margin) × 12.
2026 benchmark (KeyBanc Capital Markets & Sapphire Ventures Private SaaS Survey): Median CAC payback is 20 months, up from 12–14 months historically. By deal size: ACV under $5K → ~9 months; ACV $25K–$100K → 18–24 months; ACV $100K+ → ~24 months. If payback is over 24 months and you're not selling true enterprise, something in the funnel is broken.
7. LTV:CAC Ratio
Customer Lifetime Value ÷ CAC. Healthy: 3:1. Excellent: 5:1+ (may also signal underinvestment in growth). A ratio below 1:1 means losing money on every customer.
Common mistake: Calculating LTV using gross revenue instead of gross profit. The honest formula is (ARR × Gross Margin) ÷ Annual Churn Rate. Inflated versions get caught in board diligence.
8. Pipeline Velocity
(# Opportunities × Avg Deal Size × Win Rate) ÷ Sales Cycle (days).
CRO move: Break down pipeline velocity by segment and rep tenure to spot specific bottlenecks. Pay close attention to whether experienced reps are improving. Use this analysis to decide where to focus coaching or process changes.
The Fullcast / Pavilion 2026 data reframes the velocity question entirely: large deals are 6.4x more efficient than small ones, yet represent less than 10% of total pipeline volume. The teams that improved revenue per seller by 61% in 2026 didn't close more deals. They closed 8% fewer, on 44% larger ACV. Velocity is as much a portfolio–composition decision as it is an execution metric.
Tier 3 – Predictive
These let you forecast next quarter with confidence and intervene before deals slip away.
9. Stage–by–Stage Conversion Rates
MQL→SQL, SQL→Opportunity, Opportunity→Won. Few teams track stage–level conversion, where the real bottleneck lies.
CRO move: Analyze conversion rates at each funnel stage. If you find low conversion in late stages (such as Opp→Won), focus on addressing issues like pricing or a lack of executive sponsor support, rather than assuming a lead quality problem.
10. Forecast Accuracy
1 – |Committed – Actual| ÷ Actual. Healthy teams hit 90%+ by quarter end. Below 80% means the forecast process is broken, usually reps sandbagging, padding, or guessing.
CRO move: Track forecast accuracy by each rep, not just at the team level. The the late stages (such as Opp→Won), focus on addressing issues like pricing or a lack of executive sponsor support, rather than assuming a lead- put a sharp number on this: average week–2 forecast accuracy across the benchmark is just 48%, meaning more than half of committed pipeline slips, shrinks, or disappears. Teams with embedded execution discipline (qualification on documented buyer actions, governed stage definitions, AI–assisted momentum tracking) lift that to 94% from week one. The model isn't the problem. The operating system underneath is.
Identify which reps consistently forecast within ±5%, and flag those with wider fluctuations who may need more frequent forecast reviews until their performance becomes steadier.
11. Sales Stage Aging (Days in Stage)
Tracking how long opportunities remain in each sales stage can reveal early warning signs that a deal may be lost, often before a rep's notes indicate trouble. The Fullcast / Pavilion 2026 GTM Benchmarks found that lost deals consume an average of 225 days versus 115 days for wins – meaning every stalled deal you keep alive is sinking 2x more selling capacity than the deals that actually close.
The same report exposes a second hygiene problem behind aging: 59% of deals skip qualification, 52% skip solution validation, and 40% skip proposal. Stages get bypassed because they aren't system–enforced, and the deals that move through without those steps tend to be exactly the ones that stall later.
To address this, CROs should establish and consistently enforce clear rules for deal aging in every sales stage. For example, any deal that remains in the "Negotiation" stage for more than 30 days without progress should be flagged for review and, if no progress is made, potentially reset or marked closed–lost by the manager.
12. Quota Attainment Distribution
Not the average – the distribution.
The Fullcast / Pavilion 2026 GTM Benchmarks Report shows the headline number every CRO should sit with: 78.3% of sellers missed quota in 2026. Quota target itself dropped 13.3% year–over–year, and revenue per seller fell 17.3%. Looking at the average attainment number across your team will hide the shape of the problem. Looking at the distribution shows it.
The actionable read isn't "let go of the bottom." It's understanding what the consistently-attaining minority does differently - usually a combination of better ICP targeting, multithreading deeper, and refusing to carry stalled deals - and codifying it.
Tier 4 – Mature scale
By this stage, your board cares about three things: efficient growth, retention, and predictability.
13. Net Revenue Retention (NRR)
Calculated as (Starting ARR + Expansion – Contraction – Churn) ÷ Starting ARR.
The KeyBanc Capital Markets & Sapphire Ventures Private SaaS Survey puts median NRR for private SaaS companies at roughly 101%, down from the 110%+ levels that were typical during the 2020–2022 growth cycle. ChartMogul's SaaS Retention Report, based on 2,500+ SaaS businesses, shows the same compression trend across nearly every segment. The OpenView / High Alpha 2024 SaaS Benchmarks Report shows top–quartile NRR still above 120%.
The most important data point from SaaS Capital's 2025 Private B2B SaaS Growth Rate Benchmarks: companies with NRR ≥110% report median growth 83% higher than the population median. Moving from 90–100% NRR to 100–110% adds 5 percentage points to the growth rate. NRR is the hidden growth lever. Revenue leaders know not to under–invest in it. Regardless of the shine of new logos, the math shows why retention is vital for every org. Common business knowledge, we've heard explained a million ways, shows that it costs less to keep a customer than to acquire a nw one.
14. Expansion Revenue Rate
Upsells, cross–sells, and seat expansion as a percentage of total new revenue.
According to the Ebsta x Pavilion 2025 GTM Benchmarks Report, customer expansion now accounts for 52% of new revenue at high–performing companies. Companies seeing expansion rates below 30% at scale may be missing opportunities, either by underpricing initial deals or by not investing enough in account management.
15. Rule of 40 (Growth Rate + Profit Margin)
The single most–used efficiency metric for late–stage SaaS.
According to the 2026 State of Public SaaS Benchmarks, the median Rule of 40 among 172 public SaaS companies is 35.5, and 71 companies report a score above 40.
Not a metric to optimize directly. It's how your board judges whether your other metrics are healthy.
The metric most B2B revenue leaders are missing entirely
Marketing–sourced and marketing–influenced pipelines aren't included in the 15 above because, for most teams, the data needed to calculate them accurately doesn't exist in the CRM in a usable form.
Every CFO conversation I've had as a CRO eventually arrives at: "We're spending $X on marketing, but where's the ROI?" The honest answer for most CROs is some version of "We know it's working, but I can't prove it with concrete numbers." This issue doesn't exist because the data doesn't exist. It exists because marketing touchpoints (webinars, ebook downloads, ad clicks, partner events) live in five tools that don't talk to your opportunity records.
The Fullcast / Pavilion 2026 GTM Benchmarks put a sharp number on this disconnect too: pipeline source efficiency varies by nearly 7x across channels, but most organizations still allocate budget by volume rather than return because they don't have the source–to–revenue data wired in.
We built Heeet because, at one point or another, every CRO hits this wall. The fix isn't another standalone attribution platform living in a sixth silo. Attribution data should live natively in Salesforce or HubSpot, on the same Opportunity records that the other 15 metrics already use. When marketing–influenced revenue sits next to win rate and CAC payback in the same dashboard, the CFO conversation changes from anecdote to math, and the rest of leadership can reference the same dashboards you use to keep revenue in check.
If you're at tier 2 or 3 of this roadmap, that's the moment to add this layer. Book a Heeet demo, and we'll show you what it looks like inside your own CRM.
5 mistakes I see CROs make most often
1. Tracking too many metrics, then tracking none well. The five–to–eight–metric dashboard, reviewed weekly, beats the 30–metric dashboard, reviewed monthly, every time.
2. Reporting forecast accuracy as a team average. If three reps are 95% accurate and three are 60%, the team looks "fine" at 78%. Half your team is unforecastable. Always report distributions, not averages, for rep–level metrics.
3. Optimizing win rate without watching deal size. Pull the bottom 20% of the pipeline out of the forecast, watch the win rate climb, declare victory. Revenue impact is often negative. Always pair win rate with average deal size and total bookings.
4. Confusing leading and lagging indicators. Closed–won is lagging. By the time it moves, the work happened months ago. Pipeline velocity, MQL volume, and stage conversion are leading. Most dashboards over–weight lagging because lagging metrics feel concrete.
5. Ignoring NRR until IPO is on the horizon. By the time you decide retention matters, you've already trained two years of customers under a motion that didn't optimize for it. Start tracking NRR seriously by $5M ARR.
FAQs
What's the single most important metric for a new revenue leader?
Win rate by lead source, broken down by channel. It tells you within a quarter which acquisition channels actually produce customers, not just leads, and lets you reallocate budget. Everything else is downstream.
How many metrics should a CRO actively track?
Five to eight on the weekly dashboard. Beyond that, the dashboard becomes an archive rather than a decision–support tool.
Which metrics matter most at early–stage versus growth–stage?
Tier 1 is what early–stage needs. Add tier 2 once you cross $3M ARR. Tier 3 at $10M+. Tier 4 at $25M+. Skipping tiers builds dashboards on data that isn't yet trustworthy.
What's the difference between a marketing–sourced and a marketing–influenced pipeline?
Sourced = marketing created the first touch. Influenced = marketing touched the account at any stage before close. Influenced is usually 2–4x sourced and is typically the more honest measure of marketing's contribution. Both require attribution data that your CRM doesn't produce out of the box.
Is the Rule of 40 still relevant in 2026?
Yes, and arguably more relevant than three years ago, when growth–at–all–costs was rewarded. The 2026 State of Public SaaS Benchmarks show the median Rule of 40 sitting at 35.5 across 172 public companies, with only 71 of them above the 40 threshold. The companies that clear it consistently still command meaningful valuation premiums.
What's the biggest measurement gap CROs face today?
Connecting marketing spend to closed revenue. Every CRO can quote pipeline coverage and win rate. Few can tell you with confidence which campaigns produced the deals that closed last quarter. That gap is the difference between a CFO conversation that ends in budget cuts and one that ends in budget approval.
Want help building the metrics layer that actually predicts revenue, including the marketing–influenced pipeline most teams can't measure today? Book a Heeet demo, and we'll walk through your Salesforce or HubSpot instance live.
Other articles
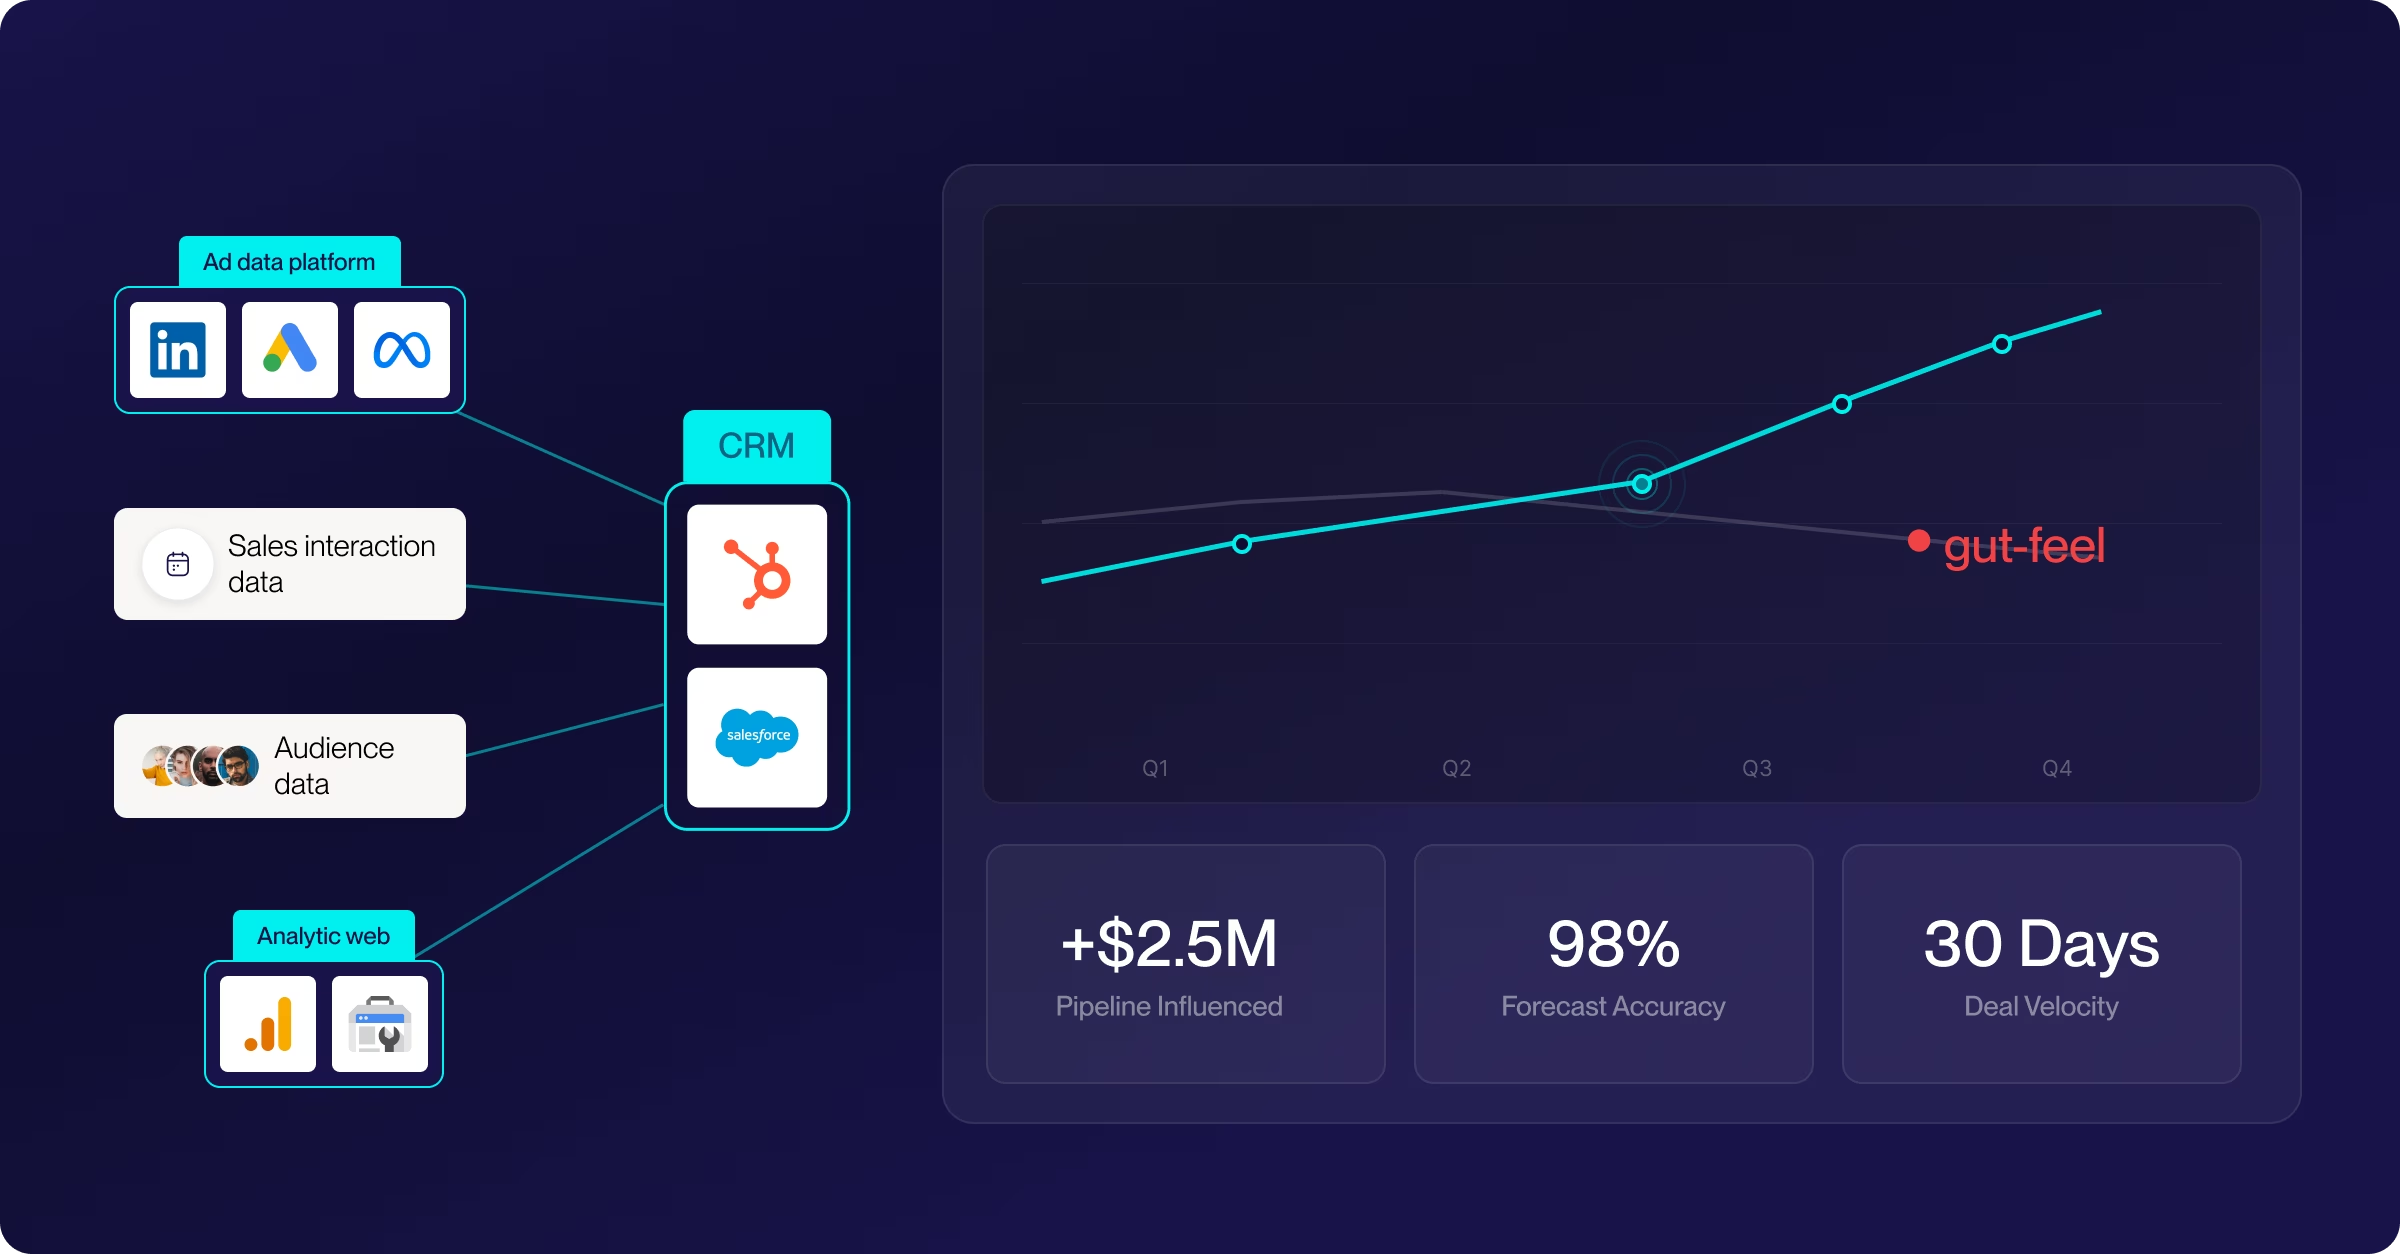
Revenue Intelligence for B2B: Data-Driven Forecasting
Learn how revenue intelligence unifies CRM, sales, and marketing data to replace gut-feel forecasts with trustworthy deal signals and actionable insights.
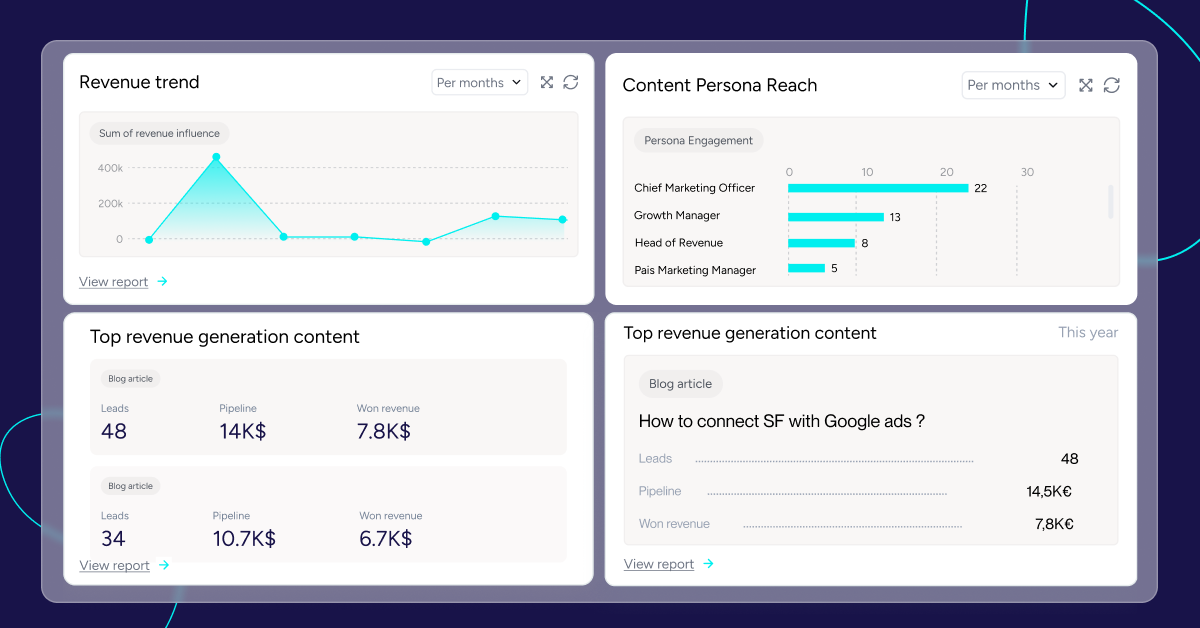
10 Best Content ROI Tools to Prove Content Drives Revenue
Compare 10 tools that connect blog posts and assets to pipeline. Features, pricing and how each handles multi-touch attribution for content teams.
AI Search Visibility: How to track the revenue impact of brand mentions
Learn to track and measure AI search ROI with proven GEO strategies. Complete guide to LLM mentions attribution, revenue tracking tools, and conversion optimization for B2B success.
.svg)
Ready to track prospects from lead to close with Heeet?
Heeet gives marketers and sales professionals at IT & Security firms turn geuss work intro informed decisions that drive revenue while meeting the same secruity technical standards you provide your clients.