

Read time :
Pipeline Velocity by Source: How to See Which Channels Move Deals Fastest
Pipeline velocity by source shows which channels close deals fastest. Learn the formula, why velocity varies by source, how to measure it in Salesforce and move faster with an analyst agent.



You're here to understand the importance of pipeline velocity and how this metric, which sits near if not at the top of the CRO's dashboard, affects your revenue forecasting. However, the all-important KPI that shows you how fast deals move through the funnel to a final sale is only useful when you can measure it by source.
Identifying which sources turn leads into paying clients lets you pinpoint the channels that perform and shift resources to drive revenue faster. How much faster? In the case of Ringover, twice as fast.
That's how much quicker one traffic source closed for Ringover, the cloud-communications company, after it moved attribution into Salesforce in 2024. Pages that large language models cited sent visitors who converted at double the speed of every other channel. Same product. Same reps. Same quarter. One source pushed deals through the pipeline twice as fast as the rest, and nobody on the revenue team could see it until the number sat next to that opportunity record.
That blind spot is what pipeline velocity by source measures. Most CROs watch a single blended velocity figure and miss the part that actually moves the forecast: where the fast deals come from. Ringover didn't fix its forecast by counting leads; they fixed it by identifying which sources accelerated deals and which stalled them quietly.
Below, you'll see how to find the same answer in your own pipeline and how we fast-track the analysis of this metric in Salesforce with Heeet Analyst Agents.
The short and sweet version:
- Pipeline velocity is how fast deals move through your pipeline and turn into revenue, expressed as revenue per day.
- Measuring by source shows you which channels close faster than others and which generate pipeline that doesn't close. It's best to avoid a blended version of this metric that hides the performance of individual channels.
- The formula: (Opportunities × Average Deal Value × Win Rate) ÷ Sales Cycle Length, run once per source.
- Velocity differs by source because intent and buying readiness differ by source, not because of lead volume.
- The math is simple enough; what's most important is getting clean, source-tagged inputs from your CRM, built around the lead record, that show the entire buyer journey from start to finish.
What is pipeline velocity, and why measure it by source?
Let's get the definition out of the way.
Pipeline velocity is the speed at which deals move through your pipeline and turn into revenue. When measured by source, it shows how quickly deals close by channel, so you can see exactly which channels produce quicker wins versus those that generate pipeline that stagnates.
If you're looking at this metric without singling out channels, you're working with a blended velocity number that hides the granularity you need to start prioritizing winning channels.
Two campaigns deployed across different channels can deliver the same number of opportunities, but one could close leads in 60 days and the other in 130. Average them together, and both look mediocre. Pull them apart by source, and the picture changes the way you allocate budget and headcount.
Pipeline velocity vs sales velocity: what's the difference?
There's really not much to it. The terms are used almost interchangeably, and most teams treat them as a single metric. Sales velocity usually refers to the full formula, including deal value and win rate, whereas pipeline velocity focuses more directly on how quickly deals move through stages.
The distinction rarely matters in a forecast meeting. The biggest issue is that both numbers stay blind until you break them down by source, and both get sharper the moment you do.
So when you see "sales velocity formula" and "pipeline velocity" in the same breath, they're describing one idea. This article uses pipeline velocity throughout. The math is identical.
How do you calculate pipeline velocity by source?
Pipeline velocity uses four inputs, calculated for each source separately:
Pipeline Velocity = (Number of Opportunities × Average Deal Value × Win Rate) ÷ Sales Cycle Length
You'll also see this written as the sales velocity formula. Same four inputs. Run it once per channel:
- Count qualified opportunities created from that source in the period.
- Average the deal value of those opportunities.
- Calculate the win rate for that source, not your global win rate.
- Measure the sales cycle length in days, from opportunity creation to closed-won, for that source alone.
- Divide. The result is the channel's revenue-per-day velocity.
Do this for organic search, paid social, events, and SDR outbound, and you get a ranked list of which sources generate revenue fastest per dollar of pipeline. The math is simple. Getting clean, source-tagged inputs out of a CRM that wasn't built to track multi-touch journeys is the hard part.
A worked example, two sources
Numbers make the gap obvious. Say you run the formula on two channels for the same quarter (illustrative figures, not customer data):
Paid social ran more than twice as many opportunities. It also produced less than a third of the daily revenue. A volume dashboard crowns paid social and tells you to pour more budget into it. Velocity by source crowns the pricing-page organic channel, the one generating $4,083 a day from fewer than half the deals, and tells you where the next dollar actually belongs.
That's the whole argument for measuring velocity per source instead of in aggregate. Blend those two rows together, and you get a forgettable mid-table number that points you nowhere.
Why does pipeline velocity differ so much by source?
Velocity differs by source because intent, buying readiness, and committee size differ by source. A prospect who arrives through a pricing-page search is closer to a decision than someone who downloaded a top-of-funnel guide. The first closes fast. The second needs nurturing, and counting them the same way distorts your whole forecast.
We see the intent signal constantly. In our own demos at Heeet, Romain checks whether a prospect visited the pricing page beforehand, because those who did engage differently and move faster. Ringover saw a sharper version of this in their data: 33% of leads that reached the pricing page converted into sales opportunities, and pages cited by LLMs drove visitors to revenue noticeably faster than standard organic traffic.
Source quality, not source volume, drives velocity. A channel can flood the top of the funnel with cheap leads that never accelerate. Another can send a trickle that closes in weeks. Volume metrics reward the first. Velocity by source exposes the second. This is also where multi-touch attribution earns its keep, because the source that opened a fast deal is often not the one that gets last-click credit.
How do you find where deals stall by source?
You find bottlenecks by reading time-in-stage per source, not just total cycle length. The total cycle length indicates that a source is slow. Time-in-stage tells you where it's slow, which is the part you can actually fix.
A source with a healthy total velocity can still hide a stalled stage. Picture two channels that both close on average within 90 days. One moves steadily. The other races to "proposal" in two weeks, then sits there for ten. Same headline number. Completely different problem. The second channel is generating interest that sales can't convert, and the only way to see it is to slice the stage durations by the deal source.
Three patterns worth watching:
- A single stage that balloons for one source. Often a qualification or security-review step that high-intent sources clear quickly and cold sources never do.
- High early-stage volume that never reaches the proposal stage. The source fills the top and starves the bottom.
- A fast source that suddenly slows. A 20% jump in one channel's cycle time, caught in week one, is a coaching conversation. Caught at quarter-end, it's a missed number.
More on catching that last one automatically below.
How do you improve pipeline velocity by source?
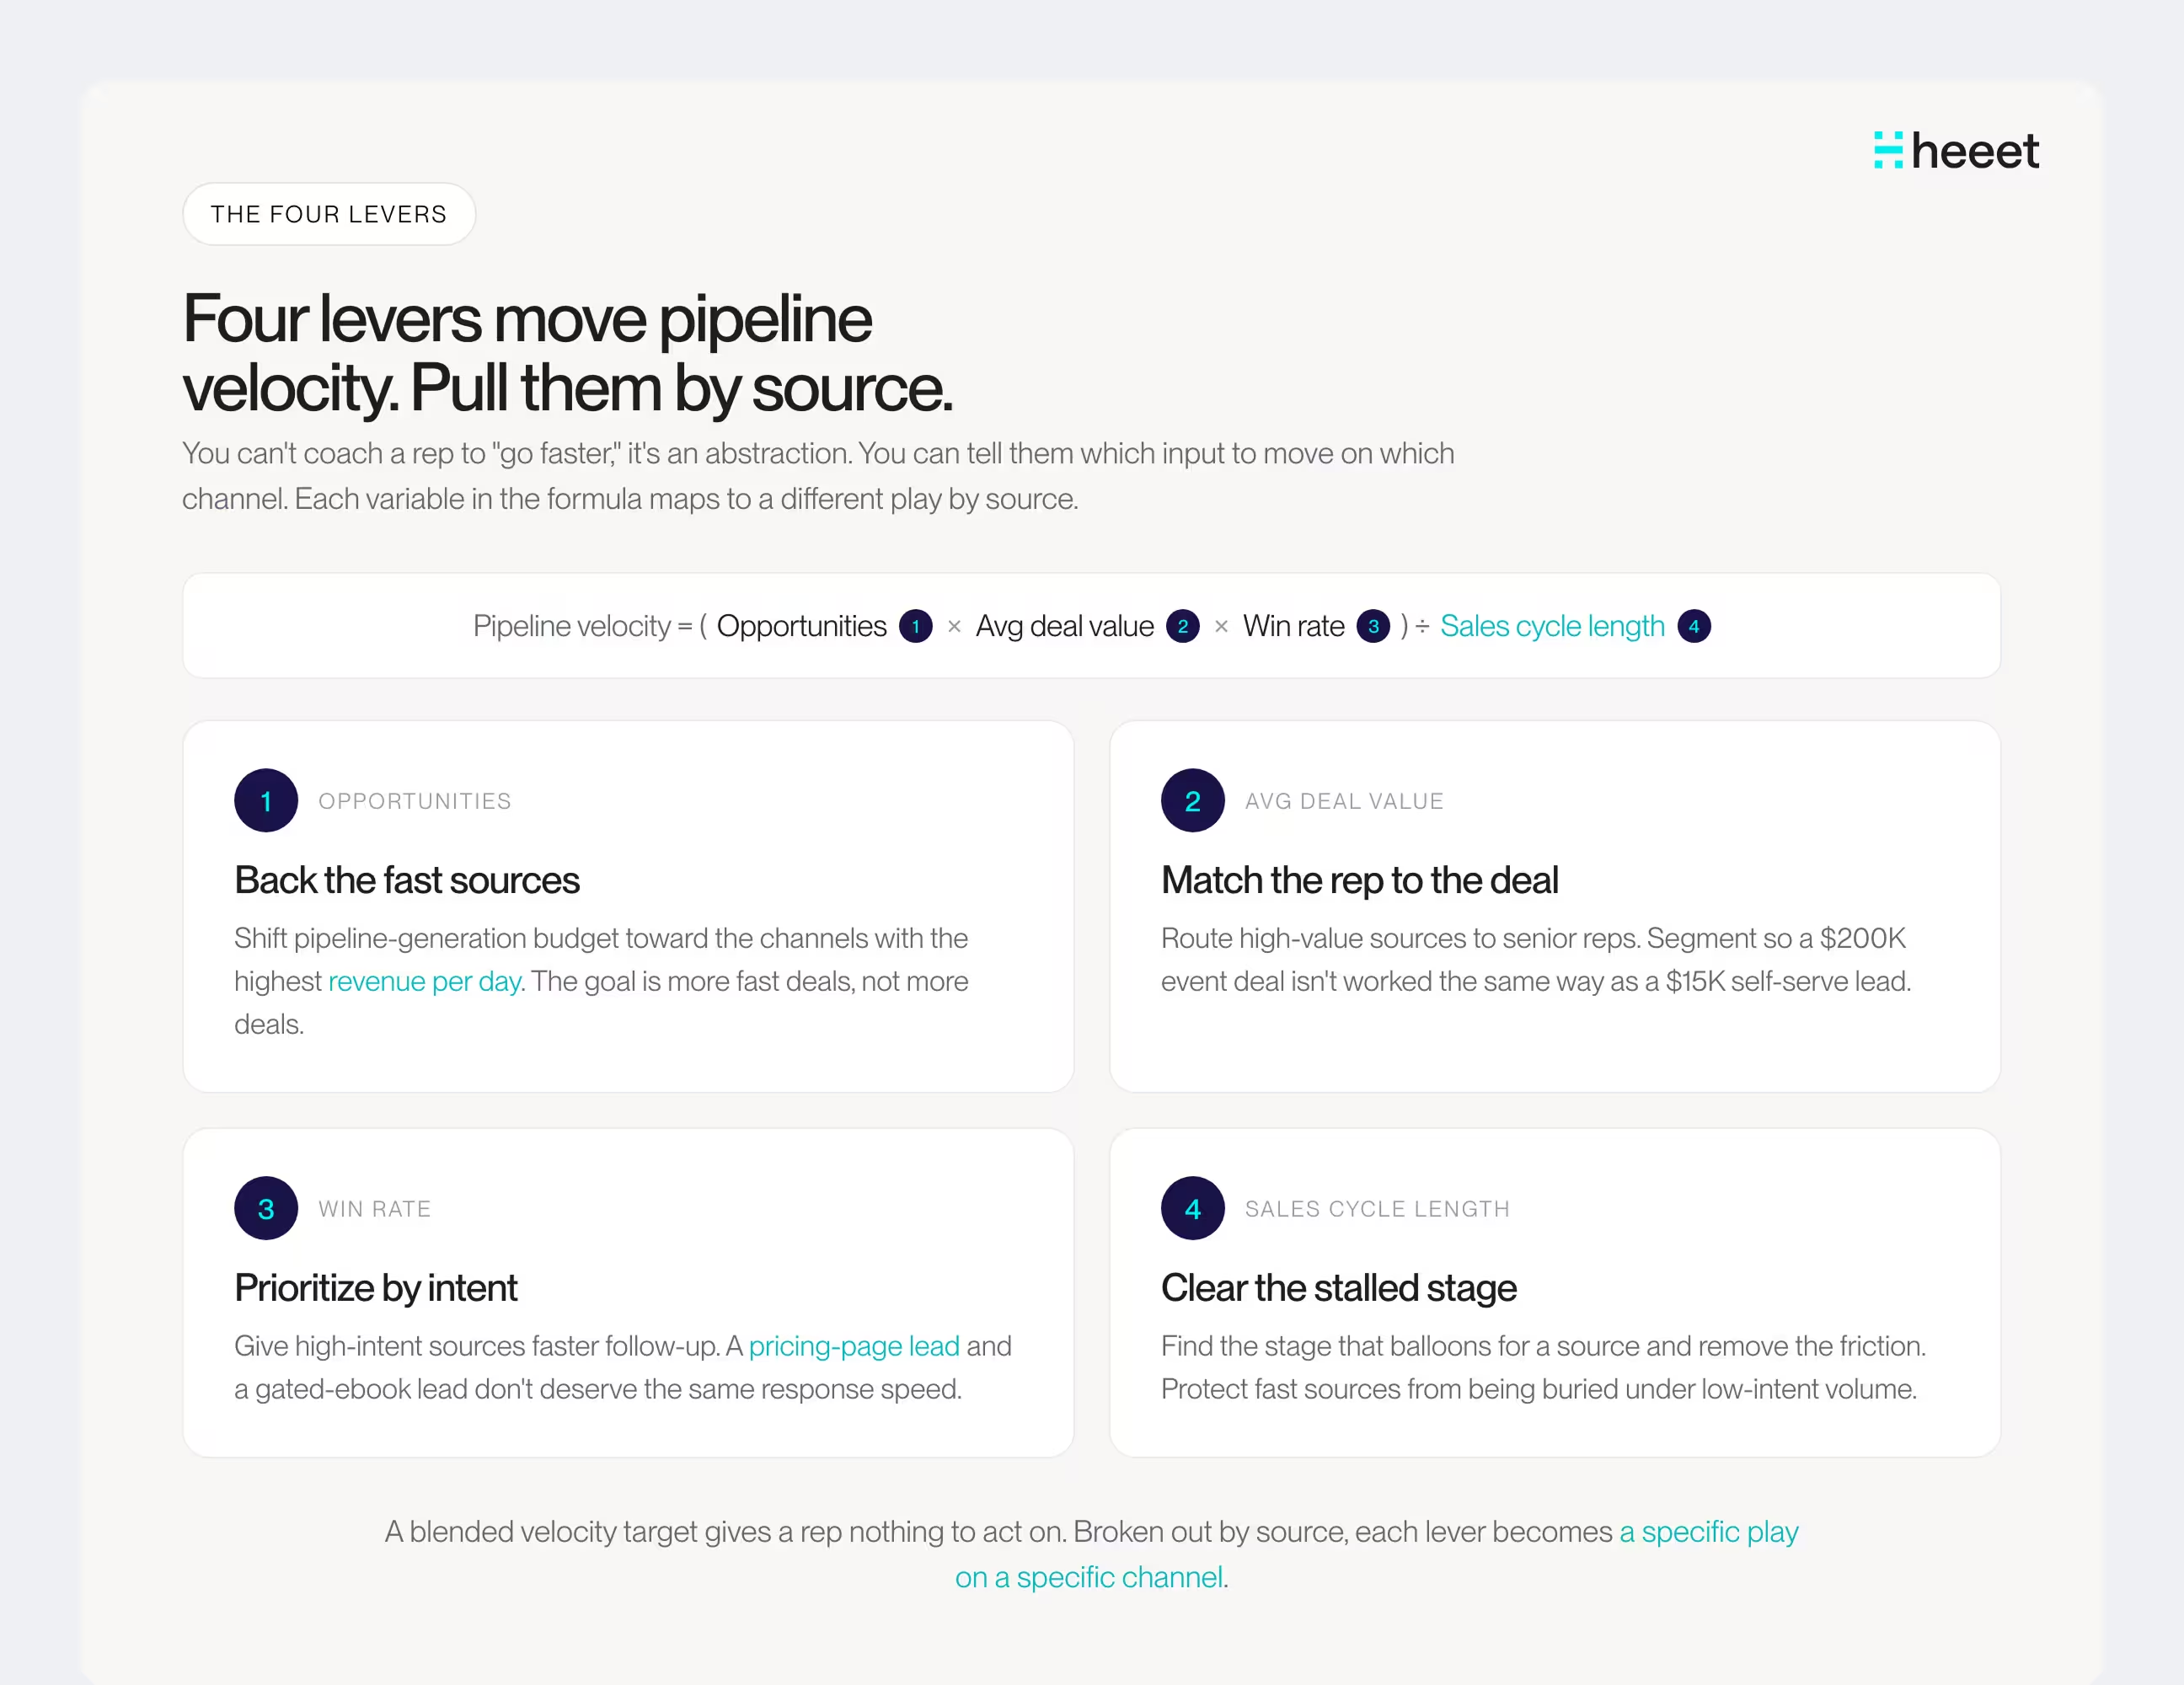
You improve pipeline velocity by moving one of its four inputs, and you do it source by source, because a blended target gives reps nothing to act on. Each lever has a different play depending on the channel.
- Opportunities. Shift pipeline-generation budget toward the sources with the highest revenue-per-day velocity. The goal is faster deals, not more deals.
- Average deal value. Route your highest-value sources to senior reps, and segment so a $200K enterprise deal from events isn't worked the same way as a $15K self-serve deal from paid social.
- Win rate. Prioritize high-intent sources when rep capacity is tight. A pricing-page lead and a gated-ebook lead do not deserve the same follow-up speed.
- Sales cycle length. Attack the stalled stage you found above. For slow-but-real sources, that usually means removing a friction step. For fast sources, it means protecting them from being buried under low-intent volume.
Here's the part most teams miss. You can't coach a rep to "improve velocity." It's an abstraction. You can tell them which sources close fast, which stage leaks, and where to spend the next hour. That's what makes velocity-by-source operational instead of just another slide.
What does good pipeline velocity look like?
There's no universal benchmark because deal size and cycle length vary widely by segment. Rough industry gradients can sanity-check whether you're in the right universe, but your own trend is the number that matters.
The gradients, for context:
- Average B2B win rate sits around 21%, according to HubSpot's 2024 Sales Trends Report. If a source is running at 4%, that's a flag worth pursuing.
- Cycle length scales with deal size. As a rule of thumb drawn from SaaStr and Optifai's 2026 pipeline data, sub-$15K ACV deals tend to close in two to four weeks, mid-market deals in one to three months, and $100K-plus enterprise deals in three to six months or longer.
- Cycles are getting longer. Ebsta and Pavilion's GTM benchmarks found that B2B sales cycles ran roughly 38% longer than in 2021 before stabilizing, and later studies pegged them around 22% longer than in 2022. Larger buying committees are the main culprit.
Now, the caveat that matters more than any of those numbers. Red & Yellow's deals span from six months to five years. Drop a "good B2B cycle is 90 days" benchmark on that business, and you'd torch a healthy enterprise pipeline for being slow. The useful comparison is always internal: this quarter versus last, and one source against another in your data. Relative ranking beats any absolute number you'll read in a benchmark report.
How to measure pipeline velocity by source with the Analyst Agent
Heeet's Analyst Agent answers velocity questions in plain language straight from your Salesforce data, so you get the by-source breakdown without building a report or pulling a spreadsheet. You ask, it reads the underlying opportunity and campaign records, and it answers with the source records attached. For a full rundown on the possibilities for every team make sure to read the Analyst Agent introduction article.
Here's the workflow a CRO can set up in an afternoon.
Step 1: Ask the velocity question directly
In the Analyst Agent, type the question the way you'd ask a sharp analyst:
"What was our average sales cycle length by lead source for closed-won deals last quarter, and how does it compare to the quarter before?"
The agent reads your Salesforce reports, returns the numbers by source, and links the records behind them so you can verify.
Step 2: Follow the thread
Velocity questions rarely stop at one answer. Ask the obvious next ones:
- "Which source had the highest win rate among deals under $50K?"
- "Where did deals spend the most days stuck in the same stage?"
- "What's our revenue-per-day velocity for paid social versus organic search?"
Step 3: Schedule the summary
Set the agent to send a weekly velocity-by-source summary to your revenue Slack channel and to Salesforce. Now the number shows up before your forecast call instead of being reconstructed during it.
Step 4: Set the alert
Tell the agent to flag the moment a source's average cycle length jumps. When your fastest channel slows by 20%, you hear about it that week, not at the end of the quarter when the gap is already baked into the forecast.
The Analyst Agent runs on Agentforce in Salesforce, so it reads the same opportunity, campaign, and ad-spend data that your reps already use. No export. No second tool. The whole thing sits on Heeet's native Salesforce integration, which is why the records it cites are the same ones your team edits.
What should a CRO do once the fast sources are clear?
Once you know which sources accelerate deals, you shift resources toward speed rather than raw volume. Shift pipeline-generation budget to the channels with the highest revenue-per-day velocity. Coach reps to focus on opportunities from fast sources when capacity is tight. And stop crediting high-volume, slow-closing channels with pipeline they take a year to convert.
This is the shift Vincent Coulondres made at Ringover. The team stopped reporting lead counts to finance and started reporting which sources produced revenue, and how quickly. That single change is why marketing and sales stopped arguing about the same number.
Where velocity-by-source goes wrong
A few traps that quietly distort the number:
- Trusting the blended average. It's the one view guaranteed to hide your best and worst channels at once.
- Tagging the source on the lead, then losing it on the opportunity. If the source doesn't survive the conversion to opportunity, your velocity math runs on guesswork.
- Counting last-click only. The channel that opened a fast deal rarely gets last-touch credit, so it looks slower than it is.
- Reading one quarter as truth. A single period can turn on a single large deal. Watch the trend.
The bottom line
Knowing which sources close fastest changes where you spend, who you hire, and how you forecast. You don't need a new data warehouse to get there, just a clean line from each source to the deals it actually moved.
If you want to see your own pipeline velocity by source pulled live from Salesforce, book a demo and we'll run the question against your pipeline.
Other articles

What Is an Analyst Agent? Heeet's AI for Revenue Insights, Inside Salesforce
An analyst agent is an AI that reads your Salesforce revenue data and tells you what's working. See what Heeet's analyst agents do, the use cases, and setup.
.svg)
Ready to track prospects from lead to close with Heeet?
Heeet gives marketers and sales professionals at IT & Security firms turn geuss work intro informed decisions that drive revenue while meeting the same secruity technical standards you provide your clients.